


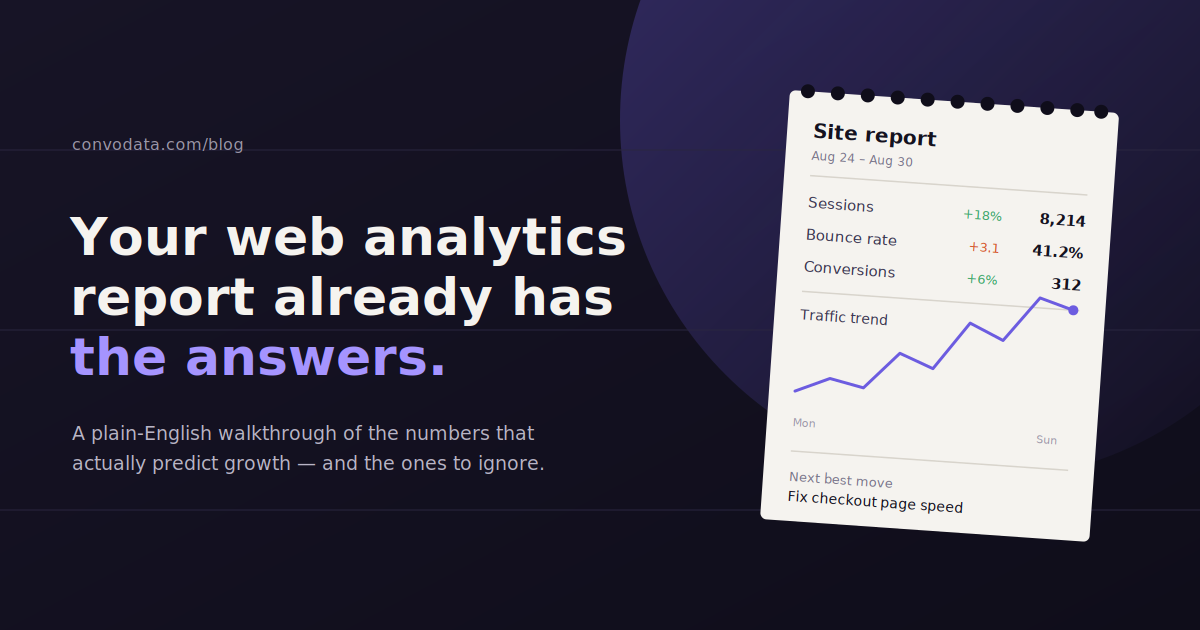
A web analytics report that lists forty metrics tells you nothing. A report built around five metrics that answer a specific question tells you everything you need to act.
Web analytics reports translate raw traffic and behavior data into something a marketer, an executive, or a client can actually use to make a decision, but only when they’re built with a clear audience and purpose in mind.
Most reports fail not because the data is wrong, but because they try to serve every audience at once, burying the one number an executive cares about under fifteen a marketer needs and nobody else does.
This guide walks through the core metrics that belong in a web analytics report, how to structure one for different readers, the tools teams typically use to build them, and the mistakes that quietly undermine even well-designed reports.
What Is a Web Analytics Report?
A web analytics report is a structured summary of how visitors interact with a website over a set period, usually pulled from a platform like Google Analytics along with other connected marketing data sources.
It differs from a live dashboard in one important way: a report is a snapshot with a narrative attached, built to answer specific questions for a specific reader, while a dashboard is an always-on view meant for ongoing self-service exploration.
The best reports don’t just present numbers. They connect a metric to a cause and, ideally, to a recommended next step, which is what separates a genuinely useful report from a data dump with a company logo on it.
Core Metrics That Belong in a Web Analytics Report
A solid web analytics report centers on traffic and sessions, conversion rate, engagement or bounce rate, channel breakdown, and goal completions, since together these answer whether the site is growing, converting, and being reached through the right channels.
Most reports go wrong by including every metric available rather than the handful that actually answer the question the reader has. These five categories cover nearly every reporting need.
Traffic and Sessions
Total sessions and users over the reporting period is the baseline metric almost every report starts with, since it establishes whether overall interest in the site is growing, flat, or shrinking.
It’s most useful compared against a prior period, whether that’s the previous month, the same month last year, or both, since a raw number without context tells the reader very little about whether performance is good or bad.
Conversion Rate
Conversion rate, the percentage of sessions that complete a defined goal, is usually the single most important number in the report, because it connects traffic directly to business value rather than just activity.
A site can gain traffic and still lose ground if conversion rate drops enough to offset it, which is exactly why traffic and conversion rate need to sit next to each other rather than in separate, disconnected sections.
Bounce Rate and Engagement Rate
Engagement rate (or its inverse, bounce rate) measures whether visitors are actually interacting with the site once they land, and it’s one of the clearest early signals that traffic quality or landing page relevance has shifted.
A spike in traffic paired with a drop in engagement rate often means a campaign or a piece of content is pulling in visitors who aren’t the right fit, which is a very different problem than a genuine drop in interest.
Channel Breakdown
Splitting traffic and conversions by channel, organic search, paid search, social, email, direct, and referral, shows where growth or decline is actually coming from, since an overall traffic number can hide a channel-level story entirely.
This is also where budget conversations get grounded in evidence: a channel that’s growing traffic but not conversions is a very different investment case than one growing both.
Goal Completions
Goal completions, whether that’s form submissions, purchases, demo requests, or newsletter signups, are the metric that ties the whole report back to what the business actually needs from the website.
Reports that stop at traffic and engagement without connecting to goal completions leave the reader to do that translation themselves, which is exactly the work a good report should have already done.
How to Structure a Report for Different Audiences
Executives need a one-page summary built around business outcomes like revenue and lead volume; marketers need the channel and campaign detail underneath it that explains why those numbers moved and what to adjust next.
The single biggest structural mistake in web analytics reporting is sending the same report to every audience. An executive and a marketing manager need the same underlying data, but they need it presented very differently.
Reports for Executives
Executives generally want three things: is the trend going up or down, what does it mean for revenue or pipeline, and is anything urgent enough to need a decision from them right now.
A one-page summary with a handful of headline metrics, a short plain-language explanation, and a clear “here’s what we recommend” section will get read. A fifteen-tab breakdown of every channel and campaign usually won’t.
Avoid jargon and avoid burying the takeaway. If traffic is down 12% because of a seasonal dip that happens every year, say that in the first sentence rather than making the reader infer it from a chart.
Reports for Marketers and Analysts
Marketers need the layer of detail an executive summary intentionally leaves out: channel-by-channel performance, landing page behavior, campaign-level conversion data, and enough segmentation to actually diagnose a problem or replicate a win.
This version of the report is where comparison periods, cohort breakdowns, and granular goal tracking earn their place. The reader here is going to act directly on what they see, not just approve a budget based on it.
Reports for Clients (Agency Context)
Client reports sit somewhere between the two: enough headline clarity that a non-technical stakeholder can follow the story, with enough supporting detail that they trust the work behind the number.
The strongest client reports connect metrics back to the specific work done that period. A conversion rate improvement means much more paired with “this is the result of the landing page redesign shipped on the 14th” than as a number on its own.
Tools Used to Build Web Analytics Reports
Most teams build reports using some combination of a native analytics platform, a visualization or dashboard layer, and increasingly, a conversational layer that answers questions directly instead of requiring someone to build a chart first.
Google Analytics remains the most common data source for web behavior, often paired with Looker Studio for teams that want full design control over the report layout at no licensing cost.
Agencies managing many client accounts frequently move to a dedicated reporting platform like AgencyAnalytics, Databox, or Whatagraph, which handle white-labeling, scheduled delivery, and multi-client templates that a spreadsheet or a single Looker Studio dashboard can’t scale to easily.
A newer approach skips dashboard-building almost entirely. Conversational AI tools like ConvoData connect directly to your analytics and marketing data sources and let you ask a plain-English question, such as “why did conversion rate drop last week,” and return a direct answer along with a suggested next step, rather than requiring you to build and interpret a chart yourself.
The right choice depends less on which tool is objectively best and more on how much time your team currently spends building reports versus acting on what they find. If report construction eats more time than analysis does, that’s usually the signal to change tools.
How Often to Send Web Analytics Reports
Monthly remains the standard cadence for a full web analytics report, since it lines up with most billing cycles and gives enough time for meaningful trends to show up without drowning the reader in noise from day-to-day fluctuation.
That doesn’t mean monthly is the only cadence worth having. A lightweight weekly check-in, even just a few headline numbers in a Slack message, catches problems faster than waiting for the full monthly report, without the overhead of building a complete report every week.
| Report Type | Recommended Cadence | Primary Audience |
|---|---|---|
| Executive Summary | Monthly | Leadership, budget owners |
| Full Marketing Performance Report | Monthly | Marketing team, analysts |
| Campaign-Specific Report | Weekly during active campaign | Campaign managers |
| Client Retainer Report | Monthly, with optional weekly check-in | Clients or external stakeholders |
| Real-Time Alert or Anomaly Flag | As it happens | Whoever owns the affected channel |
Common Mistakes in Web Analytics Reporting
Most reporting problems come down to including too much, explaining too little, or losing sight of who’s actually going to read the thing.
Reporting metrics without context. A number with no comparison period, benchmark, or trend line forces the reader to guess whether it’s good or bad.
Sending the same report to every audience. An executive doesn’t want fifteen tabs of channel data, and a marketer can’t act on a one-page summary alone.
Vanity metrics without a business tie-in. Pageviews and impressions feel good to report but mean little without a conversion or engagement metric next to them.
No narrative, just numbers. A chart showing traffic dropped is data. A sentence explaining why it dropped and what you’re doing about it is a report.
Inconsistent metric definitions across reports. If “conversion” means something different in this month’s report than last month’s, the whole trend line becomes untrustworthy.
Frequently Asked Questions
What should a web analytics report include?
At minimum, it should cover traffic and sessions, conversion rate, engagement or bounce rate, a channel breakdown, and goal completions, framed with a comparison period so the reader can tell whether performance is improving or declining.
How often should web analytics reports be sent?
Monthly is the standard cadence for a full report, often paired with a lighter weekly check-in on headline metrics so problems get caught faster than waiting for the next full report.
What's the difference between a report for executives and one for marketers?
Executive reports are a short, business-outcome-focused summary with a clear recommendation. Marketer-facing reports include the channel, campaign, and segmentation detail needed to actually diagnose issues and act on them.
What tools are used to build web analytics reports?
Google Analytics is the most common underlying data source, often combined with a visualization tool like Looker Studio or a dedicated reporting platform such as AgencyAnalytics, Databox, or Whatagraph. Conversational AI tools like ConvoData are a newer option that answer questions directly instead of requiring a dashboard to be built first.
Are pageviews still a useful metric to report?
Pageviews have value as a volume indicator but shouldn't stand alone in a report. Paired with engagement rate and conversion data, they tell a fuller story than as a single vanity number.
How do I make a web analytics report easier for non-technical stakeholders to understand?
Lead with a plain-language summary of what changed and why, keep the headline metrics to a handful, and put detailed breakdowns in a supporting section rather than the top of the report.
If building a fresh report every month is eating more time than acting on the results, connect your data sources to ConvoData and ask it your next reporting question directly, plans start at $39/month.
If you are building these reports on a recurring basis rather than one-off, see our guide to ad hoc reporting for when a one-time pull makes more sense than a template. And whichever numbers lead the report, our roundup of the top GA4 KPIs worth tracking covers what belongs at the top. If manually building reports is eating your week, these marketing analytics tools are worth a look.