


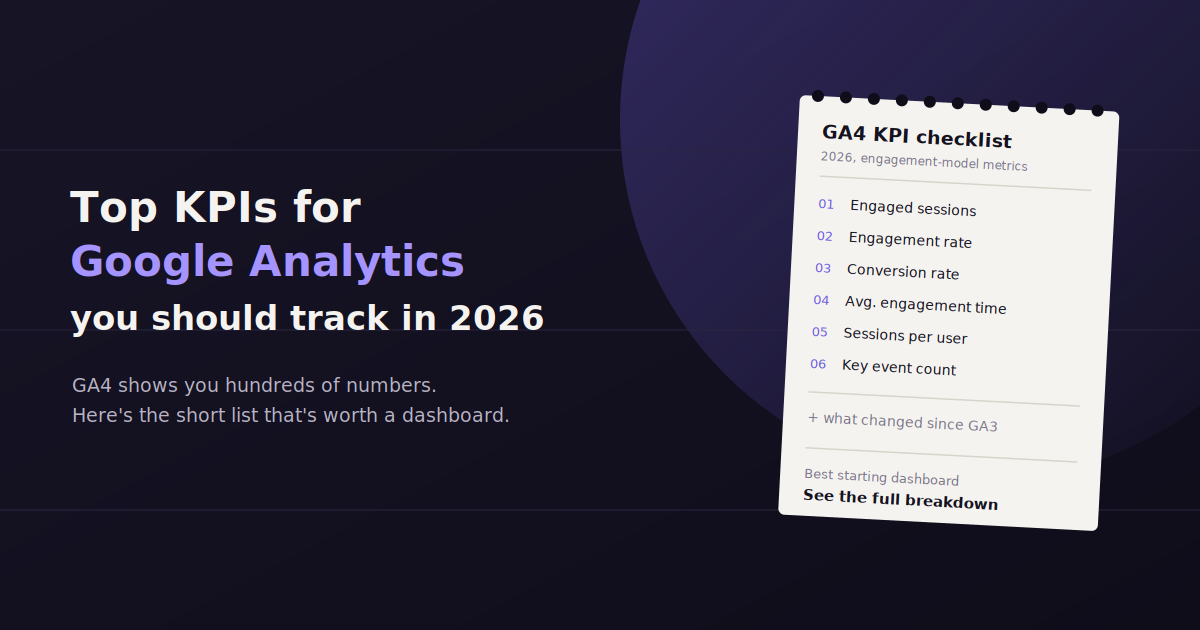
Google Analytics 4 exposes hundreds of dimensions and metrics, which is exactly the problem. Open a blank exploration report and it’s genuinely hard to know where to start looking.
Most of those metrics don’t need to be on anyone’s radar day to day. A small set does the real work of telling you whether a website and its marketing are performing.
This guide walks through the Google Analytics KPIs worth tracking, grouped by what stage of the funnel they measure, plus the mistakes that make people distrust GA4 numbers they’ve actually just misread.
Google Analytics is free, which is part of why it’s the default source of truth for most marketing teams — but free doesn’t mean self-explanatory.
Why GA4 KPIs Need More Care Than Universal Analytics Did
Anyone who used the old Universal Analytics before its 2023 retirement had to relearn how to read reports in GA4, and it wasn’t a cosmetic change. GA4 dropped bounce rate’s old definition, retired sessions as the default unit of measurement in favor of events, and changed how conversions get counted entirely.
That means a KPI that meant one thing for years can mean something subtly different now, and a report built on old assumptions will quietly mislead whoever reads it.
The metrics below reflect how GA4 actually measures things today, not carried-over habits from the old model. Getting the definitions right matters more than the metric list itself.
Traffic and Acquisition KPIs
Traffic KPIs — sessions, users, and channel breakdown — establish how many people are arriving and where they’re coming from, forming the baseline every other GA4 metric gets measured against.
These are the metrics most people check first, and for good reason: nothing downstream matters if traffic isn’t showing up in the first place. But traffic volume alone is a thin signal without knowing where it’s coming from.
Sessions and Users
A session is a group of interactions within a given time window; users counts distinct people. GA4 further splits users into total users and active users, the latter filtering out bot traffic and inactive sessions.
Watch the gap between sessions and users over time — a rising sessions-per-user ratio usually means returning visitors, which is a healthier trend than a spike driven entirely by new, one-time traffic.
Traffic by Channel
GA4’s default channel grouping splits traffic into organic search, paid search, direct, referral, organic social, paid social, and email, among others.
Tracking this over time shows whether growth is coming from a channel you’re actively investing in or from something incidental, like a referral spike from a single external link. It’s also the fastest way to catch a tracking problem — a channel suddenly reading as “unassigned” almost always means a broken UTM parameter somewhere upstream.
Landing Page Performance
Looking at sessions and conversion rate by landing page shows which pages are actually pulling weight for a given channel, rather than judging a channel’s performance as one blended average.
A channel with a mediocre average conversion rate might have one landing page performing very well and several dragging the number down — worth knowing before deciding to cut spend on the whole channel.
Engagement KPIs
Engagement rate replaced bounce rate as GA4’s default quality signal, measuring the share of sessions lasting over 10 seconds, including a conversion event, or viewing 2+ pages — a more useful read on whether visitors actually engaged.
Engagement metrics answer a different question than traffic volume: of the people who showed up, how many actually did something worth counting?
Engagement Rate (and Why It Replaced Bounce Rate)
Engagement rate is the percentage of sessions that lasted longer than 10 seconds, included a conversion event, or had at least two page or screen views. GA4’s engaged sessions metric is essentially the inverse of the old bounce rate, but measured more usefully.
The old Universal Analytics bounce rate counted any single-page session as a bounce, even if someone read a full blog post for five minutes before leaving. GA4’s engagement rate fixes that blind spot by factoring in time and interaction, not just page count.
A healthy engagement rate varies a lot by page type and industry, so the more useful comparison is against your own site’s trend over time, or against a specific page’s historical baseline, rather than an arbitrary industry number.
Average Engagement Time
This measures how long a session was actively in the foreground of a user’s browser or app, which is a more honest measure of attention than the old “time on page” metric that kept counting even when a tab sat open in the background.
It’s especially useful for content-heavy pages, where a rising average engagement time is a solid proxy for content actually being read rather than skimmed and abandoned.
Pages / Screens per Session
This tracks how many pages or app screens a user views in a session, which is a rough signal of how much someone explored beyond the entry page.
It’s most useful in context — an e-commerce site generally wants this number climbing as people browse categories, while a landing page built for one conversion action might be working fine with a low number here.
Conversion and Revenue KPIs
Conversion rate, revenue, and average order value connect GA4 activity to actual business outcomes, and are the metrics that ultimately justify or question marketing spend.
This is the category that ties everything else back to a business result. Traffic and engagement matter mostly because they feed into this.
Conversions and Key Events
GA4 renamed “conversions” to “key events” in recent updates, but the concept is the same: specific actions you’ve marked as meaningful, like a purchase, signup, or form submission.
Unlike Universal Analytics’ single conversion goal setup, GA4 tracks these as events from the start, which means almost any interaction on a site can become a trackable key event without setting up a separate goal structure first.
The most common mistake here is marking too many events as key events, which dilutes the number and makes a conversion report harder to read at a glance rather than easier.
Conversion Rate by Channel and Landing Page
Total conversions matter less than conversion rate segmented by source, because a channel driving huge traffic with a low conversion rate might be less valuable than a smaller channel converting at three times the rate.
This is where most budget-reallocation decisions actually get made — not from the top-line traffic number, but from this segmented view.
Revenue and Average Order Value
For e-commerce sites, GA4’s revenue reporting (built on top of enhanced e-commerce tracking) ties sessions and channels directly to dollars, which is the number that ultimately matters most to whoever is funding the marketing budget.
Average order value, tracked alongside revenue, helps distinguish a channel driving a high volume of small purchases from one driving fewer, larger ones — both can be valuable, but they call for different messaging and budget decisions.
GA4 KPI Benchmarks by Metric
Benchmarks vary widely by industry and traffic source, but these general ranges give a starting point for judging whether a GA4 metric needs attention.
Treat the ranges below as a sanity check, not a target. A number outside this range isn’t automatically bad — it just means it’s worth understanding why before assuming it’s a problem.
| KPI | Typical Range | What a Low Number Usually Means |
|---|---|---|
| Engagement rate | 50%–65% | Content or page-speed issue, or mismatched traffic intent |
| Average engagement time | 1–3 minutes | Content isn’t holding attention, or the wrong audience is landing here |
| Conversion rate (e-commerce) | 1%–4% | Friction in checkout flow or weak product-page match to intent |
| Conversion rate (lead gen) | 2%–6% | Form too long, unclear offer, or slow page load |
| Pages per session | 2–4 | Single-purpose landing pages are the usual exception |
| New vs. returning user split | 60/40 to 70/30 | A very high new-user share can signal weak retention |
Building a GA4 KPI Report That Actually Gets Read
A report with 40 metrics on it gets skimmed once and ignored afterward. The point of a KPI report isn’t completeness, it’s clarity about whether things are moving in the right direction.
Start with three to six KPIs tied directly to the site’s actual goal — conversion rate and revenue for e-commerce, lead volume and cost per lead for a B2B site, engagement metrics for a content or media property. Everything else is supporting detail, not the headline.
Trend lines matter more than single snapshots. A conversion rate of 2.3% means very little on its own; the same number next to last month’s 1.8% or last year’s 2.9% tells an actual story.
Pulling GA4 data into a broader report gets harder once a business runs paid ads, email, and SEO alongside organic traffic, since GA4 alone doesn’t natively blend in ad spend or email platform data. This is where a conversational AI reporting tool like ConvoData fits in — it connects to GA4 alongside other marketing data sources, so a question like “which channel had the best conversion rate this month” gets answered directly, pulled live from the connected accounts, instead of requiring a manual export and a spreadsheet formula.
Common GA4 KPI Mistakes
A handful of misreadings account for most of the confusion people run into with GA4 reporting.
Comparing GA4 numbers directly to old Universal Analytics numbers.
Different measurement models mean a direct year-over-year comparison across the platform switch will look like a shift that never actually happened.
Treating every event as a key event.
Marking scroll depth, video plays, and outbound clicks as key events alongside actual purchases buries the metric that matters in noise.
Ignoring data thresholds and sampling.
GA4 applies thresholding to protect user privacy in some reports, which can understate small-segment numbers — worth checking before treating a low figure as a real trend.
Reporting session-based metrics without checking the date range’s traffic volume.
A single day with unusually low traffic can swing engagement rate or conversion rate sharply without reflecting an actual change in performance.
Forgetting to exclude internal traffic. Without an internal traffic filter, employees testing the site skew engagement and conversion numbers, sometimes significantly for a lower-traffic site.
Not every KPI here deserves equal billing on a dashboard — our guide to website KPIs and what actually matters narrows the list further, and our piece on vanity metrics vs actionable metrics covers how to tell which of these numbers should actually drive a decision. If heat maps are part of your GA4 setup, see how to read a Google Analytics heat map alongside these KPIs.
Frequently Asked Questions
What are the most important KPIs to track in Google Analytics 4?
Engagement rate, conversion rate, sessions by channel, and revenue (for e-commerce) or key events (for lead generation) cover most of what matters. Beyond those, the right additional KPIs depend on the specific site's goals.
What replaced bounce rate in GA4?
Engagement rate replaced bounce rate as GA4's default quality signal. It measures the percentage of sessions lasting over 10 seconds, including a conversion event, or with two or more page views — a more complete read than the old single-page bounce definition.
Why does my GA4 data not match my old Universal Analytics numbers?
GA4 measures sessions, engagement, and conversions differently than Universal Analytics did, so a direct comparison across the two platforms will show differences that reflect measurement changes, not an actual shift in site performance.
How do I track revenue in Google Analytics?
Revenue tracking in GA4 requires setting up enhanced e-commerce events (purchase, add_to_cart, etc.) through Google Tag Manager or a platform integration. Once configured, GA4 reports revenue by channel, campaign, and landing page automatically.
Is Google Analytics enough on its own for marketing reporting?
GA4 covers on-site behavior well but doesn't natively combine ad spend, email performance, or social metrics into one view. Many teams pair it with a dedicated reporting tool, or a conversational tool like ConvoData, to see GA4 data alongside other channels in one place.
What's a good conversion rate in GA4?
It varies by industry and site type, but e-commerce sites typically see 1% to 4%, while lead generation sites often run 2% to 6%. The more useful benchmark is usually a site's own historical trend rather than an external average.
Want your GA4 metrics answering questions instead of sitting in a report nobody opens? Connect Google Analytics to ConvoData and ask a plain-English question about your traffic, engagement, or conversion trends — plans start at $39/month.