


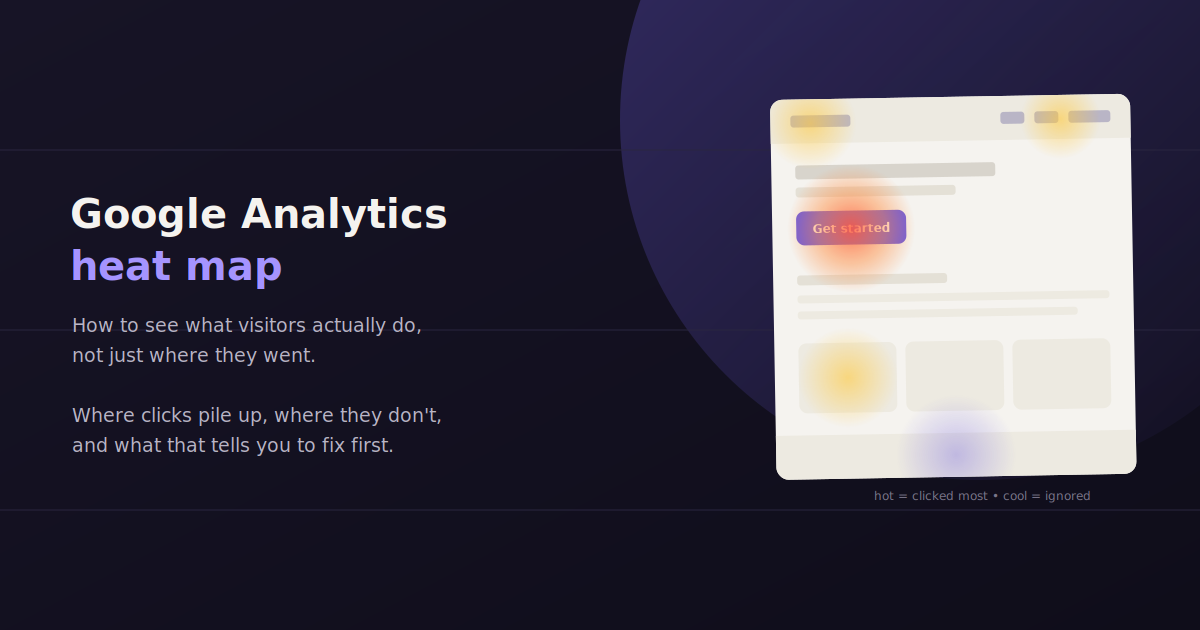
A Google Analytics heat map is one of the more commonly searched features that, strictly speaking, doesn’t exist inside Google Analytics itself.
GA4 tells you what happened — sessions, conversions, bounce rate, time on page — but it doesn’t show you where someone’s mouse moved, how far they scrolled, or which button they hovered over before leaving.
That visual layer comes from a separate category of tool, and pairing it correctly with your GA4 data is what actually answers the “why” behind the numbers.
This guide covers what heat maps show that GA4 doesn’t, the tools that generate them, and how to connect the two so you’re not toggling between five browser tabs to understand one landing page.
It’s a search that trips up a lot of marketers moving from an older analytics setup, where a heat map plugin was sometimes bundled directly into the platform. GA4’s approach is more modular — you pick a dedicated tool and wire it in yourself, which takes a bit more setup but generally produces more detailed visual data than a bundled feature would.
Why Google Analytics Doesn’t Have a Native Heat Map
GA4 is built around event tracking — page views, clicks on specific tagged elements, scroll depth as a percentage milestone, and conversions. It’s fundamentally a numbers tool, not a visual one.
A heat map requires capturing continuous mouse movement, click coordinates, and scroll behavior across every pixel of a page, then rendering that as a color-coded overlay. That’s a different kind of data collection than GA4’s event-based model was designed for.
GA4 does track scroll depth as a standard event, and you can see aggregate click data through enhanced measurement, but neither of those recreates the visual, page-level overlay that the term “heat map” usually refers to.
What a Heat Map Actually Shows You
Click maps — where visitors click or tap, including on elements that aren’t actual links, which often reveals confused user expectations.
Scroll maps — how far down a page visitors get before abandoning, shown as a gradient rather than a single percentage.
Move maps — mouse movement patterns on desktop, used as a rough proxy for where attention is going.
Session recordings — individual playback of a real visitor’s session, often paired with heat map tools to see the story behind an aggregate pattern.
Tools That Generate Heat Maps Alongside GA4
Most teams run a dedicated heat mapping tool alongside GA4 rather than trying to force GA4 into a job it wasn’t built for.
Hotjar and Crazy Egg are the two most common choices — both install a lightweight script alongside your GA4 tag and generate click, scroll, and move maps per URL, plus session recordings.
Microsoft Clarity is a free option worth mentioning here: it offers heat maps and session recordings at no cost and integrates directly with GA4, which makes it a reasonable starting point before paying for a dedicated tool.
Hotjar — click, scroll, and move maps with session recordings and on-site surveys, paid tiers scale with site traffic.
Crazy Egg — heat maps plus A/B testing and “confetti” reports that segment clicks by traffic source.
Microsoft Clarity — free heat maps and recordings, GA4 integration built in, fewer advanced segmentation options than paid tools.
How to Combine GA4 Data With Heat Map Insights
The real value shows up when you use GA4 to find the problem and a heat map to understand it. GA4 tells you a landing page has a 68% bounce rate; the heat map tells you why — visitors aren’t scrolling past the fold, or they’re clicking a headline image that isn’t actually a link.
Start with GA4 to identify underperforming pages using bounce rate, exit rate, and conversion rate by landing page. Then pull the heat map for that specific URL and cross-reference the drop-off point against the scroll map.
Use GA4 landing page reports to find pages with high traffic but low conversion or high exit rate.
Use scroll maps to check whether visitors are seeing your key content or CTA at all before leaving.
Use click maps to spot “rage clicks” or clicks on non-interactive elements, both signs of a confusing layout.
Use session recordings for a handful of real sessions on your worst-performing page to see the pattern in context, not just as an aggregate.
Setting Up a Heat Map Alongside GA4: The Basic Steps
Choose your tool based on budget and depth needed — Microsoft Clarity for a free starting point, Hotjar or Crazy Egg for more advanced segmentation and testing features.
Install the tracking script alongside your existing GA4 tag, typically through Google Tag Manager to keep both scripts organized in one place.
Set up page-specific tracking for the URLs you actually care about — most tools let you target specific pages instead of running heat maps site-wide, which keeps data cleaner and setup lighter.
Wait for a meaningful sample before drawing conclusions — check your tool’s recommended minimum session count for a reliable heat map before making a layout decision.
Cross-reference against GA4 for the same URL and date range so you’re reading both data sources side by side rather than in isolation.
Common Mistakes When Reading Heat Map Data
The biggest mistake is treating a heat map as a standalone verdict instead of a supporting layer on top of GA4 conversion data. A page can have a beautiful, evenly distributed click map and still convert poorly for reasons a heat map won’t show, like slow load time or a broken checkout step further down the funnel.
Sample size matters more than people expect. A heat map built from 40 sessions on a low-traffic page can show patterns that are just noise — wait for a meaningful sample before making a layout decision off it.
Device segmentation is easy to skip and shouldn’t be. Mobile and desktop heat maps for the same page often look completely different, and averaging them together hides the real story on whichever device drives more of your traffic.
A Worked Example: Diagnosing a High-Bounce Landing Page
Say GA4 shows a paid landing page with strong traffic but a 72% bounce rate and a conversion rate well below the site average. On its own, that tells you there’s a problem but nothing about what’s causing it.
Pulling up the scroll map for that URL shows the drop-off: only 30% of visitors scroll past the hero section, well below what similar pages on the site typically see. The click map adds another data point — a meaningful cluster of clicks on the hero image itself, which isn’t actually a link. That combination suggests visitors expect the image to be clickable (maybe assuming it leads to a product page or a demo) and leave when nothing happens.
A quick check of a handful of session recordings confirms the pattern: several visitors click the image, pause, then leave within a few seconds of no response. The fix here isn’t a redesign of the whole page — it’s either making the image a working link to the logical next step, or removing the visual cues that make it look clickable in the first place. Reporting this to a stakeholder is far more convincing paired with the specific GA4 numbers (traffic volume, current conversion rate, and a realistic estimate of the conversion lift) than the heat map alone, since the heat map explains the why but the GA4 data explains the why it matters.
Privacy Considerations for Heat Mapping Tools
Heat map and session recording tools capture more granular user behavior than GA4’s aggregated event data, which raises privacy considerations worth addressing before rolling one out, particularly for sites handling EU or California traffic under GDPR or CCPA.
Most reputable heat mapping tools, including Hotjar, Crazy Egg, and Microsoft Clarity, automatically mask sensitive form fields (like passwords and payment details) by default and offer additional masking rules for custom fields containing personal information. Confirm this is actually configured correctly for your site’s specific forms rather than assuming the default settings cover every field that needs it.
It’s also worth reflecting the addition of a heat mapping tool in your site’s cookie consent banner and privacy policy, since these tools typically set their own tracking identifiers separate from GA4’s. Treating it as a separate disclosure rather than assuming it’s covered under existing analytics consent language avoids a compliance gap that’s easy to overlook during a quick tool rollout.
Turning Heat Map Findings Into Reportable Numbers
Heat maps are visual and qualitative, while GA4 is numeric — the two work best paired: use a heat map to spot a UX problem, then verify its business impact with GA4 conversion and exit-rate data before reporting it to a client or stakeholder.
Heat maps are persuasive visuals for a client presentation, but they’re qualitative — a client will eventually ask what the fix is worth in numbers, not just a red-and-blue image.
Once you’ve spotted a UX issue in a heat map, go back to GA4 and quantify it: how many sessions hit that page, what’s the current conversion rate, and what would a realistic improvement be worth in additional conversions per month.
This is also where a conversational reporting layer helps. Instead of manually cross-referencing GA4 and your heat map tool every time a client asks about a specific page, a tool like ConvoData can pull the GA4 side of that answer instantly — exit rate, conversion rate, traffic volume for a given URL — while you focus the heat map tool on the visual diagnosis.
A heat map is one piece of a fuller Google Analytics picture — see our roundup of the top GA4 KPIs worth tracking for the metrics side, and our guide to building web analytics reports for how to pull this alongside behavioral data into something a client can actually read.
Frequently Asked Questions
Does Google Analytics have a built-in heat map feature?
No. GA4 tracks events like scroll depth milestones and clicks on tagged elements, but it doesn't generate a visual heat map overlay. That requires a separate tool like Hotjar, Crazy Egg, or Microsoft Clarity installed alongside your GA4 tag.
What's the best free Google Analytics heat map tool?
Microsoft Clarity is the most commonly used free option — it generates click, scroll, and move heat maps plus session recordings, and integrates directly with GA4 at no cost.
Can I see click data in GA4 without a heat map tool?
GA4's enhanced measurement can track clicks on specific tagged elements and outbound links as events, but it won't show you a visual overlay of where every click landed on a page — for that you need a dedicated heat mapping tool.
How many sessions do you need for an accurate heat map?
There's no universal number, but most heat mapping tools recommend at least a few hundred sessions per page before treating the pattern as reliable — pages with only a handful of visits can show misleading results.
Should I use GA4 or a heat map tool to find UX problems?
Use both together. GA4 is best for identifying which pages have a problem, based on bounce rate, exit rate, and conversion data, while a heat map tool shows you why visitors are behaving that way on the specific page.
Do heat map tools slow down site performance?
Most modern heat mapping scripts are lightweight and load asynchronously, so the performance impact is minimal, but running multiple tracking scripts alongside GA4 is still worth monitoring with a page speed tool periodically.
Can I install a heat map tool through Google Tag Manager?
Yes — most heat mapping tools, including Hotjar, Crazy Egg, and Microsoft Clarity, support installation through Google Tag Manager, which keeps the script organized alongside your existing GA4 tag rather than hardcoded separately into your site.
Should mobile and desktop heat maps be analyzed separately?
Yes — user behavior often differs significantly between devices, and averaging mobile and desktop data together can hide the real pattern on whichever device drives the larger share of your traffic.
Once your heat map tool flags the page with a problem, connect your GA4 account to ConvoData and ask it directly for that page’s traffic, conversion rate, and exit rate — no dashboard-building required, plans start at $39/month.