


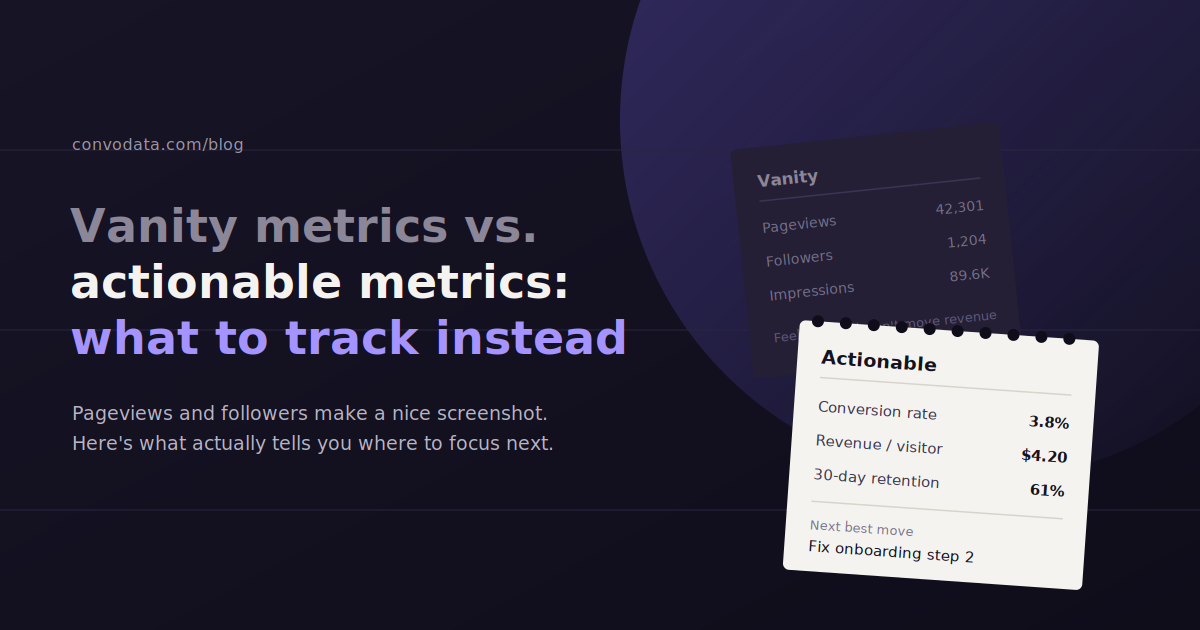
A vanity metric looks good on a slide but doesn’t tell you what to do next. An actionable metric does the opposite — it points directly at a decision you can make to change the outcome.
Follower counts, impressions, and pageviews are the classic offenders. They trend upward, they’re easy to screenshot, and they rarely explain why revenue did or didn’t move.
This guide draws a clear line between the two categories, channel by channel, and shows how to rebuild client reporting around metrics that actually justify a budget renewal.
A conversational tool like ConvoData helps here specifically because it doesn’t just surface a number — you can ask it *why* a metric moved, and it pulls the answer from your connected data instead of leaving you to guess.
What Makes a Metric a Vanity Metric?
A vanity metric is any number that rises easily, looks impressive in a report, but doesn’t reliably correlate with revenue or business outcomes. Followers, impressions, and total pageviews are common examples — they measure activity, not results.
Vanity metrics share three traits: they’re easy to grow with spend alone, they rarely require you to change strategy in response, and they can rise while the business itself stays flat.
None of that means vanity metrics are worthless. They’re often useful as diagnostic context — a sudden follower spike can flag a viral moment worth investigating. The problem is treating them as the headline result instead of a supporting detail.
The real test: if a metric doubled overnight, would you know what to do differently? If the honest answer is “nothing,” it’s probably a vanity metric.
Social media followers — easy to inflate with a giveaway or paid follow campaign, weak correlation to sales.
Impressions — a top-of-funnel delivery count, not a signal that anyone engaged or converted.
Total pageviews — can rise from bot traffic, low-intent visitors, or a single viral post that never converts.
Email list size — a large list full of disengaged subscribers can perform worse than a smaller, active one.
What Makes a Metric Actionable?
An actionable metric is tied closely enough to a business outcome that a change in the number tells you specifically what to fix. Conversion rate, CAC, LTV, and ROAS are actionable because each one points to a concrete lever you can pull.
Actionable metrics pass the opposite test: when they move, they tell you where to look and roughly what to do about it.
A dropping conversion rate points you toward landing page friction, offer clarity, or targeting mismatch. A rising CAC points you toward channel efficiency or audience saturation. Each actionable metric comes with an implicit next step attached.
The best reports lead with actionable metrics and use vanity metrics as supporting color, not the other way around.
Conversion rate — the percentage of visitors or leads that complete a desired action, directly tied to revenue.
Customer acquisition cost (CAC) — what it costs to win one customer, which tells you immediately whether a channel is worth scaling.
Customer lifetime value (LTV) — how much a customer is worth over time, which determines how much CAC you can afford.
Pipeline generated — for B2B, the dollar value of qualified opportunities a channel produced, not just leads captured.
Return on ad spend (ROAS) — revenue generated per dollar spent, the clearest paid-media performance signal there is.
Vanity vs. Actionable Metrics by Channel
Every marketing channel has a vanity-metric counterpart to its actionable metric: social has followers vs. conversion rate, SEO has traffic vs. qualified organic leads, paid has impressions vs. ROAS, and email has list size vs. revenue per send.
The same channel almost always produces one vanity metric and one actionable metric that answer a similar-sounding question in very different ways. Knowing the pair for each channel makes it easy to catch yourself reporting the wrong one.
| Channel | Vanity Metric | Actionable Metric |
|---|---|---|
| Social Media | Followers / Likes | Conversion rate from social traffic |
| SEO | Total organic traffic | Qualified leads from organic search |
| Paid Ads | Impressions | ROAS / CPA |
| List size | Revenue per send / Click-to-conversion rate | |
| Content Marketing | Pageviews | Content-assisted pipeline or conversions |
| Web Analytics | Sessions | Goal completions / Conversion rate |
Why Agencies and Marketers Default to Vanity Metrics
Vanity metrics survive in reporting decks because they’re genuinely easier to work with, not because anyone sets out to mislead a client.
They’re simple to pull — most platforms surface follower counts and impressions natively, with no attribution modeling or CRM integration required. Actionable metrics like LTV or pipeline generated often require connecting multiple data sources and doing real analysis to calculate correctly.
Vanity metrics also almost always trend upward, which makes for a comfortable monthly report. Actionable metrics can go down, and a marketer reporting a drop in conversion rate has to explain it — a harder conversation than pointing at a rising follower count.
None of this is an excuse to keep leaning on vanity metrics. It’s the reason reporting tools that automatically calculate and surface actionable metrics matter more than ones that just display whatever a platform’s API returns by default.
How to Reframe Client Reporting Around Actionable Metrics
Shift client reports by leading every section with the actionable metric first, using vanity metrics only as supporting context, and explaining the “why” behind each number instead of just the number itself.
Reframing a report doesn’t mean deleting vanity metrics entirely — it means changing their position and their framing.
Start each section of the report with the metric tied most closely to the client’s actual business goal, then use supporting metrics to explain the trend behind it. A follower count belongs in a footnote under a conversion-rate headline, not the other way around.
Every metric you report should answer an implicit “so what.” If you can’t finish the sentence “this number matters because ___,” it doesn’t belong at the top of the report.
Lead with outcomes, not activity. Put conversion rate, CAC, or ROAS in the first line of a section; move follower or impression counts to supporting context.
Always show the trend, not just the snapshot. A single-month number means less than a number moving in a clear direction over time.
Attach a takeaway to every actionable metric. State what changed and what you’re doing about it, not just what the number is.
Ask why, not just what. A metric moving is a starting point — the report should explain the likely cause, not just flag the change.
Using a Conversational Tool to Surface the “Why” Behind a Number
A conversational reporting tool lets you ask directly why a metric changed and get an answer pulled from connected data sources, instead of manually cross-referencing dashboards to explain a vanity metric spike or an actionable metric drop.
Most dashboards are built to display metrics, not explain them. When a client asks why conversion rate dropped last month, the person running the report usually has to go dig through several platforms manually to find the answer.
This is the specific gap conversational AI reporting fills. Instead of just charting CAC or ROAS over time, ConvoData lets you ask a plain-English question — “why did CAC increase in July” — and it pulls the answer live from your connected ad, analytics, and CRM data, along with a suggested next step.
That matters most exactly where vanity metrics tend to hide: when a number everyone celebrated (more traffic, more impressions, more followers) didn’t translate into the actionable metric that actually pays the bills. A conversational answer surfaces that gap immediately instead of burying it across five separate dashboards.
Vanity Metrics Aren’t Automatically the Enemy
Vanity metrics still have a place as diagnostic context and early signals — the mistake isn’t tracking them, it’s presenting them as proof of success without connecting them to an outcome the business actually cares about.
It’s worth separating “vanity metric” from “worthless metric.” A sudden spike in impressions or followers can be the first sign something is working — a piece of content resonated, a campaign found an unexpected audience — and that’s worth investigating.
The distinction is what happens after you notice the spike. A vanity metric used as a trigger to dig deeper (“why did this happen, and did it lead anywhere”) is doing useful work. The same metric presented as the headline result, with no follow-up on whether it translated into anything, is where the term earns its negative reputation.
Some businesses also have vanity metrics that are closer to actionable for their specific model. A media publisher whose revenue comes directly from ad impressions served against traffic has a legitimate reason to track raw pageviews closely — the metric that’s vanity for a lead-gen company can be near the center of the business model for a different one.
Building a Reporting Template That Prioritizes Actionable Metrics
A reporting template built around actionable metrics puts the business outcome first, uses vanity metrics only as supporting detail, and includes a short explanation of the likely cause behind any significant change — turning a data dump into a decision-making document.
The structure of a report matters as much as the metrics inside it. A template that puts vanity metrics at the top by default — because that’s the order a platform’s dashboard exports them in — trains both the reporter and the client to treat them as the headline, whether or not that was the intent.
A better structure starts each section with the outcome the client actually cares about that month, states the actionable metric tied to it, shows the trend over time rather than a single snapshot, and only then includes supporting context like impressions or follower growth where it explains part of the story.
Building this template once and reusing it across every client account also protects consistency — it stops a metric ordering choice by one team member from quietly turning a report into a highlight reel of whatever number happened to look best that month.
Section headline: the actionable metric and its trend, not the biggest available number.
Supporting detail: one or two vanity metrics, only where they add context to the trend above.
Takeaway line: a plain-English explanation of why the metric moved and what, if anything, changes as a result.
Common Mistakes When Mixing Vanity and Actionable Metrics
A few patterns show up repeatedly in reports that lean too hard on vanity metrics without meaning to.
Leading a report with the biggest number, regardless of relevance. A large pageview or impression count is often just the easiest number to feature, not the most meaningful one.
Comparing vanity metrics across campaigns with different goals. An awareness campaign and a direct-response campaign shouldn’t be judged by the same follower-growth yardstick.
Reporting growth in isolation without cost context. A bigger email list or follower count that cost more to acquire than it’s worth isn’t actually growth.
Never revisiting whether a vanity metric ever converted. If a metric has never once correlated with a business outcome after several reporting cycles, stop leading with it.
Frequently Asked Questions
Are vanity metrics always useless?
No — they're useful as supporting context or early diagnostic signals, such as flagging a viral moment worth investigating. The mistake is treating them as the primary measure of success instead of pairing them with an actionable metric.
What's the single most important actionable metric to track?
It depends on the business model, but conversion rate is the most broadly useful starting point because nearly every other actionable metric — CAC, ROAS, pipeline — is built downstream from it.
Why do clients still ask for vanity metrics like follower count?
Vanity metrics are easy to understand at a glance and almost always trend upward, which makes them comfortable to report. Part of the job is educating clients on why an actionable metric, even one that occasionally dips, tells a more useful story.
How do I calculate customer acquisition cost (CAC)?
Divide total sales and marketing spend for a given period by the number of new customers acquired in that same period. Segmenting CAC by channel shows which channels are actually efficient rather than looking at a single blended average.
Can a metric be a vanity metric in one context and actionable in another?
Yes. Pageviews are typically vanity for a lead-gen business but can be genuinely actionable for a publisher whose revenue is tied directly to ad impressions served against traffic volume.
How often should I revisit which metrics I'm reporting on?
Review your reporting metrics at least once a quarter, and any time a client's goals change — a metric that was actionable for a growth-stage push may become a vanity metric once the business shifts toward retention or profitability.
Stop leading reports with numbers that don’t explain themselves. Connect your data to ConvoData, ask it why an actionable metric like CAC or ROAS moved this month, and get a plain-English answer with a next step — plans start at $39/month.
Once you have separated vanity numbers from the ones that matter, our guide to website KPIs and what actually matters is a natural next read, and our roundup of the top GA4 KPIs worth tracking applies the same filter specifically to Google Analytics data.