


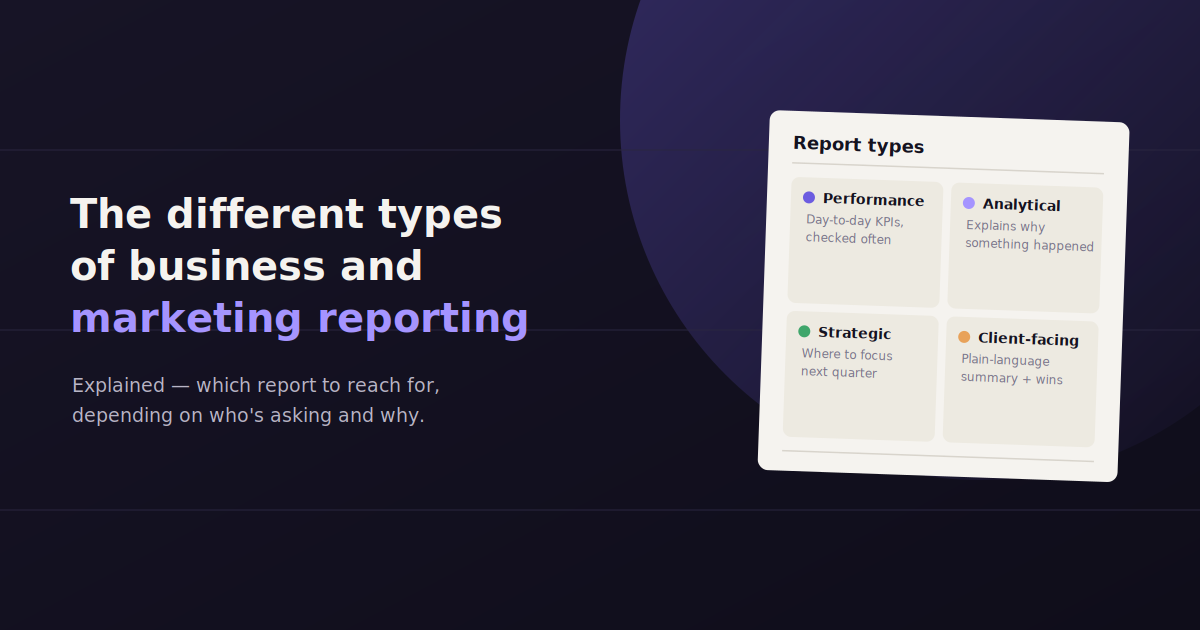
Ask five people at the same company what “the report” refers to and you’ll likely get five different answers. A sales director means a real-time pipeline dashboard. A CFO means a monthly financial statement. A marketing manager means a campaign wrap-up sent to a client.
They’re all correct, and that’s the problem — reporting isn’t one thing. It’s a set of distinct formats, each built for a different question, a different audience, and a different decision.
This guide walks through the main types of business and marketing reporting, what each one is actually for, when to reach for it, and how they fit together into something bigger than any single report: a reporting stack that covers a business from daily operations up to long-term strategy.
Why Reporting Isn’t One Category
The most common reporting mistake isn’t bad data — it’s using the wrong type of report for the question being asked. A daily operational metric dressed up as a strategic insight tells leadership nothing useful. A quarterly strategic summary sent to someone who needs to fix a problem today arrives too slow to matter.
Every report has three defining traits worth pinning down before it gets built: the audience it’s for, the decision it’s meant to support, and the cadence that matches how often that decision actually needs revisiting.
Once those three are clear, the right type of report tends to follow naturally. The categories below aren’t rigid boxes — many real reports blend two or three — but they’re a useful map for figuring out what you’re actually building and why.
The Core Types of Reporting, at a Glance
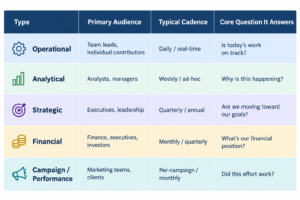
Business reporting generally splits into operational, analytical, strategic, financial, and campaign or performance reporting – each serving a different audience, time horizon, and decision, from daily task-level checks to long-term direction-setting.
Operational Reporting
Operational reporting tracks the day-to-day mechanics of running a team or process — the kind of numbers someone needs to see today to make a decision today, not next quarter.
It’s granular by nature and usually lives close to the work itself: a support team’s ticket queue, a warehouse’s daily shipment count, a paid media team’s daily spend pacing against a monthly cap. Nobody outside the team usually needs to see it, and that’s by design.
Because operational reports get checked frequently, they need to be fast to read, not narrated. A support lead glancing at ticket volume three times a day doesn’t want a paragraph of commentary — they want the number and whether it’s outside normal range.
Best for: day-to-day team management and catching problems early
Typical cadence: daily or real-time
Common examples: daily spend pacing, support ticket volume, content publishing queue, daily conversion counts
Analytical Reporting
Analytical reporting goes a step beyond operational tracking — it exists to explain why a number moved, not just report that it did. It’s investigative by nature, and it’s usually triggered by a specific question rather than a fixed schedule.
A marketing analyst noticing conversion rate dropped 15% won’t stop at the headline number. Analytical reporting is the process of segmenting that drop by traffic source, device, landing page, and time of day until the actual cause surfaces.
This is where tools like Google Analytics, Adobe Analytics, or a data warehouse queried through Google BigQuery tend to do the heaviest lifting, since answering “why” usually requires cutting the same dataset several different ways rather than reading a single pre-built chart.
Best for: diagnosing a specific change or anomaly in performance
Typical cadence: ad-hoc, triggered by a question or an unusual result
Common examples: conversion rate drop investigation, channel attribution analysis, cohort retention breakdown
Strategic Reporting
Strategic reporting zooms all the way out. It’s built for people who need to know whether the business is moving in the right direction over months or years, not whether a single number ticked up this week.
These reports intentionally leave out day-to-day noise and focus on a small set of metrics tied directly to company or department goals — market share, customer lifetime value trends, year-over-year growth, progress against annual targets.
Because strategic reports go to leadership and sometimes board members or investors, the framing matters as much as the data. A strategic report should read as a narrative about direction and trade-offs, not a longer version of an operational dashboard.
Best for: leadership decisions about direction, budget, and long-term priorities
Typical cadence: quarterly or annual, occasionally monthly for fast-moving businesses
Common examples: quarterly business review, annual growth summary, board reporting deck
Financial Reporting
Financial reporting covers the money side specifically: revenue, cost, margin, cash flow, and profitability. It often overlaps with strategic reporting but deserves its own category because it usually follows stricter formatting and compliance requirements, especially for public companies or anyone with outside investors.
In a marketing context, financial reporting is where spend and return get tied together in dollar terms rather than platform metrics — marketing-attributed revenue, blended customer acquisition cost, marketing spend as a percentage of revenue.
This is also the report type most likely to get scrutinized line by line, so accuracy and consistent methodology matter more here than in almost any other category. A financial report that changes its own definitions from quarter to quarter loses credibility fast.
Best for: understanding profitability, cost efficiency, and financial health
Typical cadence: monthly or quarterly, tied to accounting periods
Common examples: P&L statements, marketing ROI summaries, budget-versus-actual reports
Campaign and Performance Reporting
Campaign and performance reporting sits closer to the marketing function specifically. It measures a defined effort — a campaign, a channel, an initiative — against the goal it was built to hit, usually over a set window with a clear start and end.
This is the type most client-facing agencies and in-house marketing teams live in day to day: monthly channel reports, quarterly campaign wrap-ups, individual campaign performance summaries. It blends operational-level metrics with strategic-level framing — specific enough to show what happened, but interpreted enough to say what it means.
The defining trait of a good performance report is the comparison it makes: results against a pre-set target, not just results in isolation. A number with nothing to compare it to tells a stakeholder very little.
Best for: proving the value of a specific marketing effort or channel over time
Typical cadence: per-campaign, or monthly/quarterly for ongoing channel performance
Common examples: monthly SEO report, campaign wrap-up report, paid media performance summary
Ad-Hoc vs. Scheduled Reporting
Beyond content, reporting also splits by trigger: scheduled reports run on a fixed calendar regardless of whether anything unusual happened, while ad-hoc reports get built in response to a specific question, request, or event.
Scheduled reporting is the backbone of most reporting stacks because it creates a predictable rhythm stakeholders can plan around — a monthly report that always arrives on the 3rd builds trust simply through consistency. It’s efficient to template but can feel disconnected from the moment if something urgent happens between cycles.
Ad-hoc reporting fills that gap. It’s slower to standardize since every request is different, but it’s where a lot of the highest-value analysis actually happens — a CEO asking “why did we lose that deal” the day after it happened isn’t going to wait for next month’s scheduled report.
When Scheduled Reporting Works Best
Recurring stakeholder check-ins (monthly client reports, weekly team standups)
Metrics that need consistent trend tracking over time
Compliance or financial reporting with fixed deadlines
When Ad-Hoc Reporting Works Best
Investigating an unexpected spike or drop
Answering a specific one-off question from leadership or a client
Testing a hypothesis before committing it to a permanent dashboard
For a deeper look at when to reach for a one-off pull instead of a standing report, see our dedicated guide to ad hoc reporting.
Real-Time and Dynamic Reporting vs. Static Reporting
A separate but related distinction is how a report behaves once it’s delivered: static reports are a snapshot frozen at a point in time, while real-time or dynamic reports stay connected to live data and update continuously.
Static reports — a PDF export, a slide deck, a printed summary — are easy to archive, easy to send, and unambiguous about what period they cover. They’re the right choice whenever a report needs to serve as a fixed record: a board deck, a client deliverable, an audit trail.
Dynamic reports, usually a live dashboard or a connected query tool, trade that fixed-in-time clarity for immediacy. They’re better suited to operational and analytical use cases where the whole point is seeing the current state, not last month’s.
Static reports are best for records, client deliverables, and anything that needs a fixed point-in-time reference.
Real-time/dynamic reports are best for operational monitoring and answering questions as they come up, not on a fixed schedule.
Most mature reporting stacks use both — static for the formal, recurring deliverables, dynamic for the day-to-day pulse.
How These Reporting Types Fit Together in a Stack
None of these report types replace each other — a healthy reporting stack uses several at once, each covering a different layer of the same business.
Picture it as a pyramid. Operational reports sit at the base, covering the widest volume of day-to-day activity, checked most often by the fewest number of decisions per check. Analytical reports sit above that, pulled in whenever something in the operational layer needs explaining. Campaign and financial reporting sit in the middle, translating both layers into results tied to goals and dollars. Strategic reporting sits at the top, synthesizing all of it into direction for leadership.
The failure mode most teams hit isn’t missing a layer — it’s building each layer as a separate manual project with its own spreadsheet, its own export process, and its own person who has to remember to run it. That’s usually where reporting stacks quietly collapse under their own maintenance cost.
Choosing the Right Type for the Question You’re Actually Asking
In practice, the fastest way to pick the right report type is to start from the question, not the data. “Is today on pace” points to operational. “Why did this happen” points to analytical. “Are we on track for the year” points to strategic. “Did this specific effort work” points to campaign reporting.
Tools have historically forced a choice here — a dashboard platform like Looker Studio, Tableau, or a template-based tool like Whatagraph is built around a fixed layout you design once and revisit on schedule, which suits scheduled and strategic reporting well but is clunky for a one-off ad-hoc question.
That’s the gap conversational tools are starting to close. With ConvoData, the same connected data can answer an operational question one day (“is today’s paid spend on pace”) and a strategic one the next (“how has blended CAC trended over the last two quarters”) without switching tools or rebuilding a dashboard — you just ask the question the report type would normally exist to answer, and get a live answer with a suggested next step.
Frequently Asked Questions
What are the main types of business reporting?
The main types are operational, analytical, strategic, financial, and campaign or performance reporting. Most organizations use a mix of these, plus the ad-hoc vs. scheduled and static vs. dynamic distinctions layered on top.
What's the difference between operational and strategic reporting?
Operational reporting covers day-to-day, granular activity checked frequently by teams close to the work. Strategic reporting covers long-term direction and goal progress, checked less often by leadership, with day-to-day noise deliberately filtered out.
When should a report be ad-hoc instead of scheduled?
Use ad-hoc reporting for one-off questions, unexpected anomalies, or hypotheses that don't yet warrant a permanent recurring report. Scheduled reporting is better for anything that needs consistent trend tracking or supports a recurring stakeholder check-in.
Is a real-time dashboard always better than a static report?
No. Real-time dashboards are better for operational monitoring, but static reports are better whenever a fixed, unambiguous record is needed — a client deliverable, a board update, or an audit trail that shouldn't change after it's sent.
How does campaign reporting differ from financial reporting?
Campaign reporting measures a specific marketing effort against the goal it was built for, usually in platform metrics like clicks or conversions. Financial reporting measures money specifically - revenue, cost, margin - often with stricter formatting and consistency requirements.
How many types of reports does a typical marketing team actually need?
Most marketing teams end up using at least three: an operational layer for daily pacing, a campaign or performance layer for proving results, and some strategic reporting for leadership check-ins. Analytical reporting gets layered in as needed rather than run on a fixed schedule.
Instead of maintaining a separate report for every layer of your reporting stack, connect your data sources to ConvoData and ask the question directly – operational, analytical, or strategic – and get a live answer with a next step attached. Plans start at $39/month.
Once you have picked the right reporting format, our 10 agency reporting tips that improve client retention covers how to execute it well, and our guide to agency metrics and KPIs every owner should track covers what to actually put in it.