


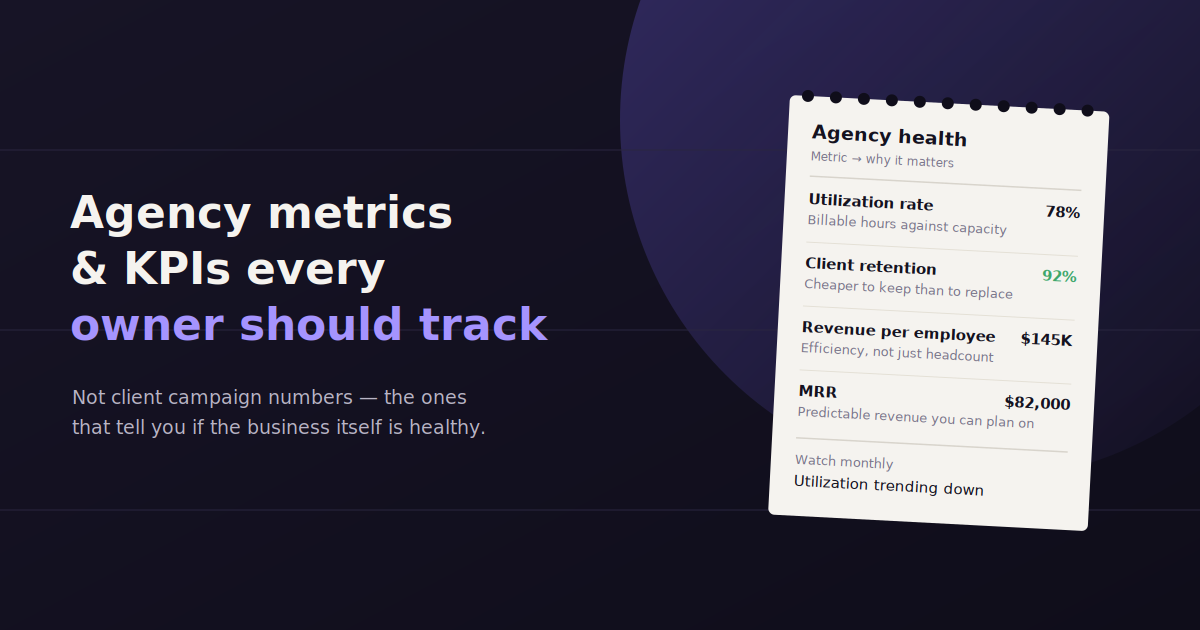
Client campaign performance isn’t the only thing an agency needs to measure — the agency’s own business health is a separate, equally important set of numbers.
Agency metrics and KPIs cover profitability, utilization, and retention — the internal numbers that determine whether the business itself is healthy, regardless of how any single client campaign performs.
This guide covers the KPIs that matter most, organized by category, and benchmarks to compare against.
For agencies also trying to speed up client-facing reporting, a conversational tool like ConvoData can free up account manager time that goes back into the metrics below.
Profitability Metrics
Gross margin per client — revenue minus direct cost to service that account, showing which clients are actually profitable versus just busy.
Effective hourly rate — total client revenue divided by hours worked, a reality check against your stated billing rate.
Client lifetime value (LTV) — total revenue expected from a client relationship over its full duration.
Revenue per employee — a broad efficiency signal for comparing your agency against industry benchmarks.
Utilization and Capacity Metrics
Utilization rate measures the percentage of an employee’s available hours spent on billable client work, typically targeting 70-85% for most agency roles — too low wastes capacity, too high risks burnout and quality issues.
Utilization rate — billable hours divided by total available hours.
Capacity forecast — projected utilization based on the current pipeline, used to plan hiring or business development timing.
Overtime hours — a leading indicator of burnout risk if consistently high across the team.
Client Retention Metrics
Client retention rate — the percentage of clients still active after a given period, usually tracked annually.
Net revenue retention — revenue from existing clients including upsells, minus churn, showing whether the existing book is growing or shrinking.
Average client tenure — how long clients typically stay, a strong proxy for satisfaction and reporting quality.
Growth and Pipeline Metrics
New business win rate — proposals won divided by proposals sent.
Average deal size — trending this over time shows whether the agency is moving upmarket or downmarket.
Sales cycle length — how long from first contact to signed contract, useful for forecasting revenue timing.
How Agency Metrics Tie Back to Client Reporting Quality
There’s a direct link between internal agency metrics and client-facing reporting quality: an agency with low utilization often has account managers spread thin, which shows up as late or inconsistent client reports — one of the biggest drivers of churn.
Improving reporting efficiency isn’t just about looking polished to clients — it directly frees capacity that shows up in utilization and margin metrics.
Common Mistakes Tracking Agency Metrics
Tracking revenue growth without tracking margin can hide a business that’s growing in size but shrinking in profitability, since new clients often come in at lower initial margins.
Measuring utilization without considering quality creates pressure to maximize billable hours at the expense of thoughtful, effective work.
Reviewing these metrics only annually, rather than monthly or quarterly, means problems compound for months before anyone notices the trend.
Tools for Tracking Agency Business Metrics
Time-tracking and project management tools like Harvest or Productive.io capture the raw data behind utilization and margin metrics.
For the client-facing reporting layer that eats account manager time, Whatagraph or a conversational tool like ConvoData, starting at $39/month, can free up hours that directly improve utilization.
Setting Realistic Benchmarks by Agency Size
A five-person agency and a fifty-person agency should not be judged against the same utilization or margin targets — team structure and overhead ratios change the healthy range at each stage.
Smaller agencies often show higher utilization simply because founders are doing billable work themselves alongside running the business, which isn’t sustainable as a permanent state even though it looks efficient on paper.
Larger agencies naturally see utilization dip as more people move into account management, quality control, and specialist roles that support billable work without being billable themselves.
| Agency Size | Target Utilization | Target Gross Margin | Typical Retention |
|---|---|---|---|
| 1–5 people | 75–90% (founders often bill heavily) | 50–60% | 70–80% annually |
| 6–15 people | 70–85% | 55–65% | 80–85% annually |
| 16–50 people | 65–80% (more management overhead) | 55–65% | 85–90% annually |
| 50+ people | 60–75% | 50–60% (more specialization cost) | 88–93% annually |
Building a Monthly Agency Metrics Review
A structured monthly review turns these KPIs from numbers on a dashboard into decisions, which is where most agencies actually fall short — not in collecting the data, but in acting on it consistently.
Step 1: Pull utilization and margin by account, not just company-wide. Company-wide averages hide the two or three unprofitable accounts dragging down an otherwise healthy book of business.
Step 2: Flag any account with margin below 40% or utilization assigned to it trending down for two consecutive months. These are the accounts most likely to be quietly draining capacity without anyone noticing until the quarterly review.
Step 3: Cross-reference flagged accounts against retention risk signals — late report delivery, reduced client engagement, scope creep without repricing. Often the same handful of accounts show up on both lists.
Step 4: Decide on one action per flagged account — reprice, rescope, reassign staff, or, in persistent cases, part ways with the client. Reviewing the same problem account for three straight months without a decision is itself a decision, just a passive one.
Step 5: Compare pipeline and win rate against the prior quarter to make sure new business is replacing at a healthy pace, not just filling gaps left by churn.
Metrics That Get Overlooked But Matter
Scope creep rate — the percentage of accounts doing unbilled work beyond the original contract. This rarely gets tracked formally but is one of the biggest silent margin killers in service businesses, since it erodes profitability without ever showing up as a line item.
Time-to-first-value for new clients — how long it takes a new client to see a meaningful result or deliverable. Agencies that shorten this window tend to see materially better first-year retention, since early proof of value is what most new relationships are won or lost on.
Report turnaround time — how long after a reporting period ends before the client actually receives their report. Agencies rarely track this explicitly, but it correlates closely with perceived responsiveness and, over time, with renewal decisions.
Referral rate — the percentage of new business coming from existing client referrals. A low referral rate despite high stated satisfaction scores is often a sign that clients are satisfied but not impressed enough to actively recommend the agency.
Leading Indicators vs. Lagging Indicators
Retention rate and annual margin tell you what already happened; utilization trend and pipeline coverage tell you what’s about to happen — a healthy metrics practice tracks both, but weights decisions toward the leading ones.
Lagging indicators — retention, annual revenue growth, realized margin — are useful for confirming whether past decisions worked, but by the time they move, the underlying cause is usually months old. Waiting for retention to drop before addressing an account issue means the client relationship is already damaged.
Leading indicators — utilization trend, pipeline coverage ratio, proposal response time, scope creep flags — move first and give an agency a chance to intervene before the lagging number confirms a problem. A pipeline coverage ratio dropping below 3x expected close revenue, for example, predicts a revenue gap two or three months before it shows up on the P&L.
The mistake most owners make is building dashboards full of lagging indicators because they’re easier to define and pull, then wondering why the numbers always feel like they’re reporting yesterday’s news. Deliberately including two or three leading indicators changes a monthly review from a postmortem into an early-warning system.
How to Present These Metrics Internally Without Losing the Room
A common failure mode is presenting fifteen KPIs in a single dense spreadsheet at a monthly all-hands, which reliably produces glazed eyes rather than action — the volume of numbers overwhelms whatever signal was actually important that month.
A tighter approach is a one-page scorecard limited to five to seven metrics, each with a target, the actual number, and a simple status color. This forces a decision about what actually matters this month rather than reporting everything that’s measurable.
Pair each metric with a single owner responsible for moving it, not just reporting it. A utilization number with no one accountable for improving it tends to stay flat quarter after quarter, since visibility alone rarely changes behavior without ownership attached.
Separate the metrics review from the metrics discussion. Circulate the scorecard a day or two ahead of the meeting so the room spends its time debating what to do about the numbers, not reading them for the first time live.
Where Agencies Get Their Metrics Data From
Financial metrics — margin, revenue per employee, LTV — typically come from accounting software (QuickBooks, Xero) combined with a project management or time-tracking tool that attributes hours to specific clients.
Utilization and capacity metrics live almost entirely in time-tracking systems, which is why agencies with inconsistent time-logging habits often have the least reliable utilization numbers, regardless of how sophisticated their reporting dashboard looks.
Retention and pipeline metrics usually live in a CRM, though many smaller agencies track this in a shared spreadsheet, which works fine at small scale but becomes error-prone once more than a couple of people are updating it.
Pulling all of this into one place, rather than checking four separate systems every month, is where a lot of the real time cost of internal reporting hides — a conversational tool like ConvoData can connect several of these sources and answer questions like utilization trend or account margin directly, without a manual pull each month.
Once you know which metrics to track, the next step is presenting them in a way that actually keeps clients engaged — see our 10 agency reporting tips that improve client retention. And for the retention strategies these metrics ultimately support, see our guide to agency client retention.
Frequently Asked Questions
What is a good utilization rate for an agency?
Most agencies target 70-85% for billable roles — lower wastes capacity, and consistently higher than 85-90% risks burnout and declining work quality.
What's the difference between client retention and net revenue retention?
Client retention measures the percentage of clients still active; net revenue retention measures revenue from existing clients including upsells and churn, giving a fuller picture of account growth or shrinkage.
How often should agencies review their internal KPIs?
Monthly for utilization and pipeline metrics, which change quickly; quarterly for margin and retention trends, which are more meaningful over a longer window.
What agency metric best predicts future revenue?
Pipeline value combined with historical win rate gives the most direct forward-looking revenue estimate, though net revenue retention is the best predictor of revenue stability from the existing client base.
How do I know if a client account is unprofitable?
Calculate gross margin per client by subtracting the fully loaded cost of hours spent on the account from the revenue it generates. Any account consistently below 40% margin, or trending downward for two or more months, is worth a repricing or rescoping conversation.
Should agencies track scope creep as a formal metric?
Yes — scope creep rarely shows up on a P&L directly, but it quietly erodes margin on individual accounts over time. Tracking unbilled hours against the original contract scope makes it visible before it becomes a habit.
What's a healthy client retention rate for a marketing agency?
Most established agencies target 85-90% annual retention. Newer or smaller agencies often see more volatility, closer to 70-80%, since a single client loss represents a much larger share of the total book.
What's the difference between a leading and a lagging metric?
Lagging metrics, like annual retention or realized margin, confirm what already happened. Leading metrics, like utilization trend or pipeline coverage ratio, move earlier and give an agency time to react before the lagging number reflects the problem.
How many metrics should be in a monthly agency scorecard?
Five to seven is a practical range. More than that dilutes attention across too many numbers, and fewer than five risks missing an important trend — pair each metric with a clear owner responsible for moving it.
Pull your agency’s utilization and retention numbers for the last quarter, and if account manager time is the bottleneck behind them, test whether automating reporting with ConvoData frees up enough capacity to move the needle.