


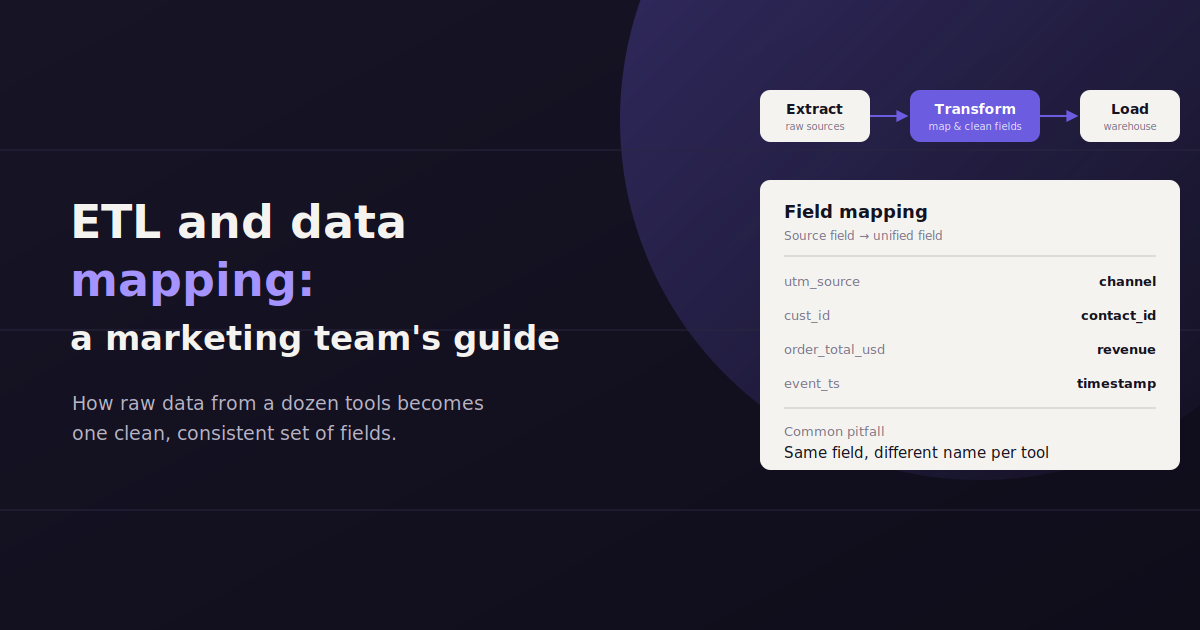
ETL stands for extract, transform, load — the process of pulling data out of a source system, reshaping it into a consistent format, and loading it into a destination where it can be reported on.
Data mapping is the specific piece of that process where the real work happens: deciding how a field in the source system corresponds to a field in the destination, so “spend” in Google Ads and “cost” in Meta Ads Manager both end up meaning the same thing in the final report.
Marketing teams run into this constantly, even when nobody on the team would describe their job as “data engineering.” Any time a report blends numbers from more than one platform, some version of ETL and data mapping is happening, whether it’s automated or done by hand in a spreadsheet.
This guide covers what ETL and data mapping actually mean, why marketing teams encounter them, how a data map gets built, the transformation problems that come up most often, and the tools and approaches teams use to manage it.
What ETL Means for Marketing Teams
ETL — extract, transform, load — is the process of pulling data from a source (an ad platform, a CRM, an analytics tool), reshaping it into a consistent format, and loading it into a destination like a spreadsheet, warehouse, or reporting tool.
Extract is the pull: connecting to a platform’s API or exporting a file to get the raw data out. Transform is where the data gets cleaned and reshaped — renamed fields, converted currencies, standardized date formats. Load is putting the transformed data somewhere usable, whether that’s a spreadsheet, a data warehouse, or directly into a reporting tool.
Marketing teams rarely build a full ETL pipeline the way a data engineering team would. More often, ETL happens in pieces — a Google Sheets export here, a manual CSV cleanup there — which is exactly why data mapping problems tend to accumulate quietly instead of getting caught early.
What Data Mapping Actually Is Within ETL
If ETL is the pipeline, data mapping is the blueprint that says what goes where. It’s the explicit correspondence between a field in the source system and a field in the destination — Facebook’s “amount_spent” maps to your report’s “spend” column, Google Ads’ “cost” maps to the same column, and so on.
Without an explicit map, this correspondence gets decided implicitly and inconsistently, usually by whoever happens to be building the report that week. Data mapping makes that decision once, documents it, and applies it the same way every time.
This matters most when combining data from more than one source into a single metric. A blended cost-per-lead number is only meaningful if every platform’s “lead” and every platform’s “cost” have been mapped to genuinely equivalent definitions first.
Why Marketing Teams Run Into ETL and Data Mapping
Marketing data is inherently scattered. A single campaign might generate data in an ad platform, get tracked in an analytics tool, capture a lead in a CRM, and close a deal in a sales tool — four systems, four different schemas, one story that only makes sense combined.
Reporting is where this scattering becomes unavoidable to deal with. A client or executive doesn’t want four separate exports; they want one number that represents total performance, and getting there requires mapping every source into one consistent structure first.
Blending ad platforms — Google Ads, Meta, LinkedIn, and others each use different field names and metric definitions for conceptually similar things.
Connecting CRM data — mapping a marketing-qualified lead to what the sales team calls the same record, so pipeline and revenue can be tied back to the campaign that generated it.
Combining analytics tools — GA4, a rank tracker, and a social analytics tool each define “engagement” or “session” differently, and a blended report has to pick one consistent definition.
Historical system migrations — moving from one CRM or ad platform to another means mapping old field structures to new ones so historical reporting doesn’t break.
How a Data Map Gets Built
Building a data map is less about tools and more about a sequence of decisions, made once and then applied consistently.
Defining the Destination Schema
Start with the destination, not the sources. Decide what the final report or dashboard needs to show — its column names, its metric definitions, its structure — before looking at what any individual source calls things.
This ordering matters because starting from the sources tends to produce a destination schema shaped by whatever platform happened to be mapped first, rather than by what the report actually needs to communicate.
Mapping Source Fields to the Destination
With the destination schema defined, go source by source and document exactly which field feeds which destination column — Meta’s “reach” maps here, Google Ads’ “impressions” maps there, and where two sources have no true equivalent, that gets marked explicitly rather than guessed at.
This is also where you decide on unit consistency: currency, date format, and naming conventions all need to be standardized as part of the mapping, not left for whoever builds the report to reconcile later.
Handling Exceptions and Edge Cases
No mapping survives contact with real data without exceptions — a platform renames a field, a currency conversion rate shifts, a record shows up in two sources at once.
A durable data map documents how exceptions get handled, not just the happy-path mapping, so the next person who touches it isn’t guessing at a decision that was already made once.
Common Transformation Challenges
The transform step is where most of the actual difficulty in ETL lives — extraction and loading are largely mechanical, but transformation requires judgment calls that are easy to get wrong or apply inconsistently.
| Challenge | Why It Happens | What It Breaks |
|---|---|---|
| Currency mismatches | Ad accounts running in different local currencies | Blended spend totals that overstate or understate real cost |
| Timezone differences | Platforms reporting on different default timezones | Daily totals that don’t reconcile across sources for the same day |
| Naming mismatches | Each platform uses its own field and metric names | The same concept treated as different metrics in a blended report |
| Deduplication | The same conversion or contact recorded in more than one system | Inflated totals that overstate real performance |
Tools and Approaches Marketing Teams Use
Marketing teams handle ETL and data mapping across a spectrum, from fully manual to fully automated, and most land somewhere in between depending on team size and technical resources.
At the manual end, teams export CSVs and reconcile them by hand in spreadsheets — workable at small scale, but it doesn’t hold up once more than a couple of data sources or clients are involved.
At the more automated end, connector tools like Windsor.ai, Supermetrics, and Funnel.io handle the extract and transform steps against a growing library of marketing platform APIs, loading standardized data into a spreadsheet, warehouse, or dashboard tool like Looker Studio or Google BigQuery.
A different approach skips building a persistent mapped destination for every question a team might ask. ConvoData connects directly to marketing data sources and lets you ask a question in plain English, handling the underlying mapping between sources behind the scenes rather than requiring a small team to maintain a manual mapping layer themselves. It won’t replace a full data warehouse for a large enterprise pipeline, but it meaningfully reduces the manual mapping burden for a lean team that just needs a trustworthy blended answer.
Signs Your Reporting Process Needs a Better Data Map
Most teams don’t set out to build a formal data map — they back into needing one once the manual reconciliation process starts visibly breaking down. A few warning signs tend to show up before anyone officially calls it a mapping problem.
The most common one is a report where the same metric shows a different number depending on who built it. If two people can pull “total leads” for the same period and land on different totals, that’s rarely a data quality issue — it’s almost always a mapping inconsistency, where each person made a slightly different judgment call about which source fields count.
Reports take longer to build every month instead of less — a sign the reconciliation work is manual and growing with every new data source added.
Numbers don’t match between two people’s versions of the same report — a mapping problem, not a data problem, almost every time.
Nobody on the team can explain how a blended metric is actually calculated — if the mapping logic only lives in one person’s head, it isn’t documented, and it isn’t safe.
Adding a new client or platform means starting the mapping process over — the map should be a reusable structure, not a one-time exercise repeated from scratch.
Common ETL and Data Mapping Mistakes
Most mapping failures aren’t caused by a difficult technical problem — they’re caused by a decision that got skipped early and never revisited.
Mapping fields without agreeing on definitions first — matching “leads” to “leads” across two platforms means nothing if the two platforms count a lead differently.
No documentation of the mapping logic — when the person who built it leaves, the next person has to reverse-engineer decisions that were never written down.
Ignoring currency and timezone at the mapping stage — these get treated as report-time cleanup instead of being resolved once, at the source, in the map itself.
No deduplication strategy — combining sources without a rule for overlapping records inflates totals in a way that’s hard to catch after the fact.
Rebuilding the map from scratch for every new client or campaign — a mapping structure should be a reusable template, not a one-off exercise repeated every time.
Frequently Asked Questions
What does ETL mean in marketing reporting?
ETL stands for extract, transform, load: pulling data out of a source like an ad platform or CRM, reshaping it into a consistent format, and loading it into a destination such as a spreadsheet, warehouse, or reporting tool where it can be analyzed.
What is data mapping, specifically, within ETL?
Data mapping is the explicit correspondence between a field in a source system and a field in the destination — for example, deciding that both Meta's 'amount_spent' and Google Ads' 'cost' map to a single 'spend' column in the final report.
Why do marketing teams need to think about ETL and data mapping?
Marketing data is scattered across ad platforms, analytics tools, and CRMs by default. Any report that blends numbers from more than one of these sources requires some form of ETL and data mapping, whether it's done manually or by a connector tool.
What are the most common data transformation challenges in marketing reporting?
Currency mismatches between ad accounts, timezone differences between platforms, inconsistent field naming across sources, and duplicate records — such as the same lead appearing in both an ad platform and a CRM — are the most frequent issues.
Do small marketing teams need dedicated ETL tools?
Not always. Small teams often start with manual spreadsheet reconciliation, but that breaks down past two or three data sources. Connector tools like Windsor.ai, Supermetrics, and Funnel.io, or a conversational tool like ConvoData that connects directly to sources, become worthwhile once manual mapping starts eating real time each month.
How do you avoid data mapping mistakes when combining marketing data sources?
Define the destination schema before mapping any source fields to it, agree on shared metric definitions before matching fields across platforms, document the mapping logic and exception handling, and build a deduplication rule before combining sources rather than after.
What's a warning sign that a team's data mapping needs fixing?
The clearest sign is when two people pull the same metric for the same period and get different numbers. That's almost always a mapping inconsistency — each person applying slightly different logic to combine sources — rather than a raw data quality issue.
Who should own data mapping on a marketing team?
Ideally one person or a small group who documents the logic somewhere the whole team can reference, rather than letting it live only in whoever originally built the report. Ownership matters more than technical skill — the goal is consistency, not sophistication.
If manual field mapping is eating time your team could spend on strategy, ConvoData connects directly to your marketing data sources and handles the blending for you — ask your first question and see the answer, starting at $39/month.
ETL sits between raw ingestion and a usable warehouse — see our guide to data ingestion, batch vs streaming for the step before this one, and our piece on data aggregation done right for what typically happens after mapping is complete. If a warehouse is the end goal, see how to build a marketing data warehouse.