


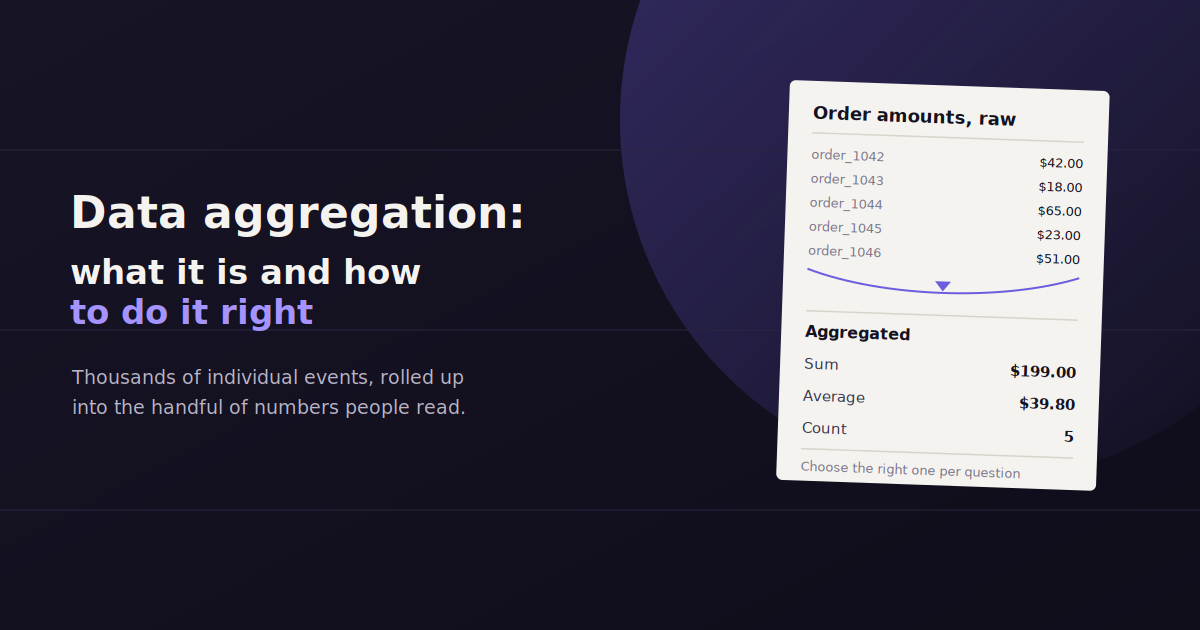
Data aggregation is the process of pulling data from multiple sources and combining it into a single, summarized view that’s actually usable for analysis or reporting.
For marketing teams, that usually means merging numbers from Google Analytics, ad platforms, CRM records, and social channels into one report instead of flipping between six logged-in tabs every time someone asks how a campaign performed.
Done manually, aggregation is tedious and error-prone — copy-paste mistakes and stale exports are the norm. Done well, it’s the difference between a report that takes two hours to build and one that updates itself.
This guide covers how the aggregation process actually works, the difference between manual and automated approaches, and where tools like ConvoData fit into a modern reporting workflow.
What Is Data Aggregation?
Data aggregation is the process of collecting data from multiple sources and combining it into a summarized, unified form — turning raw numbers from separate platforms into a single view that supports analysis, comparison, and decision-making.
At its core, aggregation answers a simple problem: your data doesn’t live in one place. Website traffic sits in Google Analytics, ad spend sits in Google Ads or Meta Ads Manager, leads sit in a CRM, and none of those systems talk to each other by default.
Aggregation pulls the relevant pieces from each source, standardizes them into a common format, and rolls them up — by day, week, campaign, or channel — so they can be compared side by side.
It’s different from raw data collection. Collection is gathering the individual events (a click, a session, a form fill); aggregation is summarizing those events into something a human can actually read and act on, like “total leads by channel this month.”
How the Data Aggregation Process Works
Aggregation typically happens in three stages, whether it’s done by hand in a spreadsheet or automatically inside a reporting platform.
Understanding these stages matters even if a tool handles them for you — it’s how you diagnose a number that looks wrong, and how you evaluate whether a new reporting tool is actually doing the job correctly.
1. Extraction
The first step pulls raw data out of each source — an API call to Google Analytics, an export from an ad platform, a query against a CRM database.
This is the stage most prone to silent failure. An expired API token or a changed field name in a source platform can quietly stop data from flowing without triggering an obvious error, which is why automated tools with active connector maintenance matter more than they seem to at first.
2. Transformation
Raw data from different platforms rarely matches format. One platform reports revenue in cents, another in dollars; one labels a channel “paid_search,” another labels it “cpc.” Transformation standardizes all of it into consistent units and naming.
This step also handles deduplication — the same conversion can sometimes get counted by both a CRM and an ad platform, and a good transformation layer reconciles that instead of double-counting it in the final report.
3. Summarization and Presentation
The final step rolls the cleaned data up into the level of detail that’s actually useful — daily, weekly, or monthly totals, broken out by campaign, channel, or region — and presents it as a chart, table, or plain-language answer.
This is where the aggregated data becomes a decision-making tool instead of just a bigger spreadsheet. The goal isn’t more data in one place; it’s the right summary at the right altitude.
Manual vs. Automated Data Aggregation
Manual data aggregation means copying numbers from each platform into a spreadsheet by hand — flexible but slow and error-prone. Automated aggregation uses API connectors to pull and combine the same data continuously, cutting reporting time from hours to minutes while reducing copy-paste mistakes.
Manual aggregation is exactly what it sounds like: someone logs into each platform, exports or copies the relevant numbers, and assembles them in a spreadsheet or slide deck.
It works fine at small scale — a single account with two or three data sources — but it doesn’t scale. Every additional client or data source adds linear time to the process, and every manual copy is a chance for a transcription error to slip into a client-facing number.
Automated aggregation replaces the copy-paste step with API connectors that pull data on a schedule, apply consistent transformation rules, and refresh the summary without anyone touching a spreadsheet. The upfront setup takes longer than one manual report, but it pays for itself within a month or two for anyone reporting on more than a handful of accounts.
Manual aggregation: flexible, no software cost, but slow, inconsistent between team members, and doesn’t scale past a few accounts.
Automated aggregation: faster after setup, consistent formatting every time, and scales to dozens of accounts — but requires connectors that support your specific data sources.
Levels of Data Aggregation Maturity
Teams tend to move through three stages as their reporting needs grow. Recognizing which stage you’re in helps decide whether it’s time to invest in better tooling.
Most teams don’t consciously choose a level — they get stuck at whichever one their current tools and time allow, until reporting pain forces a change.
Level 1 — Incomplete view: Decisions get made from whichever single platform’s dashboard is open, without cross-referencing other sources. Fast, but often wrong.
Level 2 — Manual aggregation: Someone builds a spreadsheet or slide deck combining data from multiple sources by hand, usually monthly. Better, but time-intensive and inconsistent.
Level 3 — Automated aggregation: A tool pulls and combines data from connected sources continuously, either into a live dashboard or a conversational query interface, freeing the team to focus on interpreting the numbers instead of assembling them.
Why Aggregated Data Matters for Marketing Reporting
A single platform’s numbers rarely tell the full story. Ad spend without conversion data tells you cost, not return. Traffic without revenue tells you volume, not value. Aggregation is what turns isolated numbers into a usable answer.
It’s also the foundation for trend analysis. Comparing this month to last month, or this campaign to the last one, only works if the underlying data is structured consistently across periods — which is exactly what a solid aggregation process guarantees.
For agencies specifically, aggregation is what makes multi-client reporting sustainable. Without it, every client report is a one-off build; with it, a template or query can be reused across accounts with minor adjustments.
Aggregated vs. Disaggregated Data
Aggregated data is summarized — total conversions by channel, average order value by month. Disaggregated data is the raw, individual-event level — every single session, click, or transaction on its own row.
Both have a place. Aggregated data is what goes in front of a client or executive because it’s fast to read. Disaggregated data is what an analyst drills into when an aggregated number looks off and needs root-cause investigation.
A good reporting setup keeps both accessible: the summary for quick answers, and the ability to drill down into the underlying detail when a number needs explaining.
Common Data Aggregation Challenges
Even automated aggregation runs into predictable problems. Knowing them in advance makes them faster to spot and fix instead of quietly skewing a report for weeks.
Most of these issues trace back to one root cause: source platforms change their APIs, naming conventions, or attribution logic without warning, and the aggregation layer has to keep up.
Attribution mismatches — a platform’s ad manager and your analytics tool often credit the same conversion to different channels, producing numbers that don’t reconcile.
Time zone inconsistencies — one source reporting in UTC and another in local time can shift daily totals by a full day, throwing off week-over-week comparisons.
Broken connectors — an expired API token or a platform’s schema change can silently stop data from flowing into an aggregated report without an obvious error message.
Double-counting — the same event captured by two overlapping sources (a CRM and an ad platform, for instance) can inflate totals if the aggregation layer doesn’t deduplicate.
Sampling — some platforms return sampled rather than complete data at high volumes, which can quietly understate true totals in an aggregated report.
Best Practices for Reliable Data Aggregation
A handful of habits separate teams whose aggregated numbers are trustworthy from teams who quietly stop believing their own reports.
None of these require exotic tooling — they’re mostly discipline around naming, checking, and documenting the aggregation process consistently.
Standardize naming before you aggregate — agree on one set of channel and campaign names across every platform so a rollup doesn’t split “Paid Search” and “paid_search” into two rows.
Spot-check against the source — periodically compare an aggregated total against the raw number in the original platform to catch drift early.
Document your transformation rules — write down how revenue is converted, how conversions are deduplicated, and how attribution is handled, so a new team member (or a new tool) can replicate the logic.
Set a single source of truth per metric — when two platforms could both report a number, decide in advance which one wins, rather than re-litigating it every reporting cycle.
Audit connectors regularly — a quarterly check that every data source is still authenticated and pulling correctly catches silent failures before they reach a client report.
How Aggregation Tools Handle This Automatically
Modern reporting tools automate the extraction, transformation, and summarization steps of data aggregation by connecting directly to each data source’s API, applying consistent formatting rules, and refreshing on a schedule — removing the manual copy-paste work entirely.
Most reporting platforms — from dashboard builders to conversational tools — handle aggregation the same underlying way: a connector pulls data from each source’s API, a transformation layer standardizes it, and the interface presents the summarized result.
Where they differ is in the last step. Dashboard-style tools like Whatagraph present the aggregated data as a chart or table you build once and reuse. Conversational tools like ConvoData skip the chart-building step and let you ask a plain-English question — “what was total spend across all channels last week” — and get the aggregated answer directly, pulled live from your connected sources.
Either approach beats manual aggregation on speed and consistency. The right choice depends on whether your team wants a permanent visual dashboard on screen, or fast answers to specific questions as they come up.
Aggregation only works well once the underlying ingestion is solid — see our guide to data ingestion, batch vs streaming for that foundation. And if you are centralizing this data long-term, our piece on building a marketing data warehouse covers where aggregated data typically ends up living.
Frequently Asked Questions
What is an example of data aggregation in marketing?
Combining daily ad spend from Google Ads and Meta Ads with website conversions from Google Analytics into a single weekly report showing cost per conversion by channel is a common example of data aggregation.
What's the difference between data aggregation and data integration?
Data integration is the broader process of connecting and combining data from different systems so they can work together; data aggregation is a specific outcome of that process — summarizing the combined data into totals, averages, or other rollups.
Is data aggregation the same as data warehousing?
No. A data warehouse is where combined data is stored long-term; aggregation is the process of summarizing that data into a usable form. Many teams warehouse raw data first, then aggregate it for reporting.
How long does it take to set up automated data aggregation?
Connecting a handful of common sources — GA4, an ad platform, a CRM — typically takes under an hour with a modern reporting tool, compared to hours of manual work rebuilt every reporting period.
Can small businesses benefit from data aggregation, or is it only for enterprises?
Small businesses often benefit more relatively, since they typically don't have a dedicated analyst to do manual aggregation — an automated or conversational tool replaces work that would otherwise fall on an already-stretched marketer.
What data sources are most commonly aggregated for marketing reports?
Website analytics (like GA4), search performance (Search Console), paid ad platforms (Google Ads, Meta Ads), email marketing platforms, and CRM or sales data are the most commonly combined sources in a standard marketing report.
Why do aggregated numbers sometimes not match a single platform's dashboard?
This usually comes down to attribution differences, time zone settings, or deduplication logic — each platform can define and count a conversion slightly differently, so an aggregated total won't always match any one source exactly.
What skills does a team need to set up data aggregation in-house?
Building a custom aggregation pipeline from scratch typically requires some data engineering skill to manage APIs and transformation logic; using a pre-built reporting or conversational tool removes that requirement almost entirely.
Skip the spreadsheet-stitching entirely. Connect your data sources to ConvoData and ask for the aggregated number you need — in plain English, pulled live, with a suggested next step attached. Plans start at $39/month.