


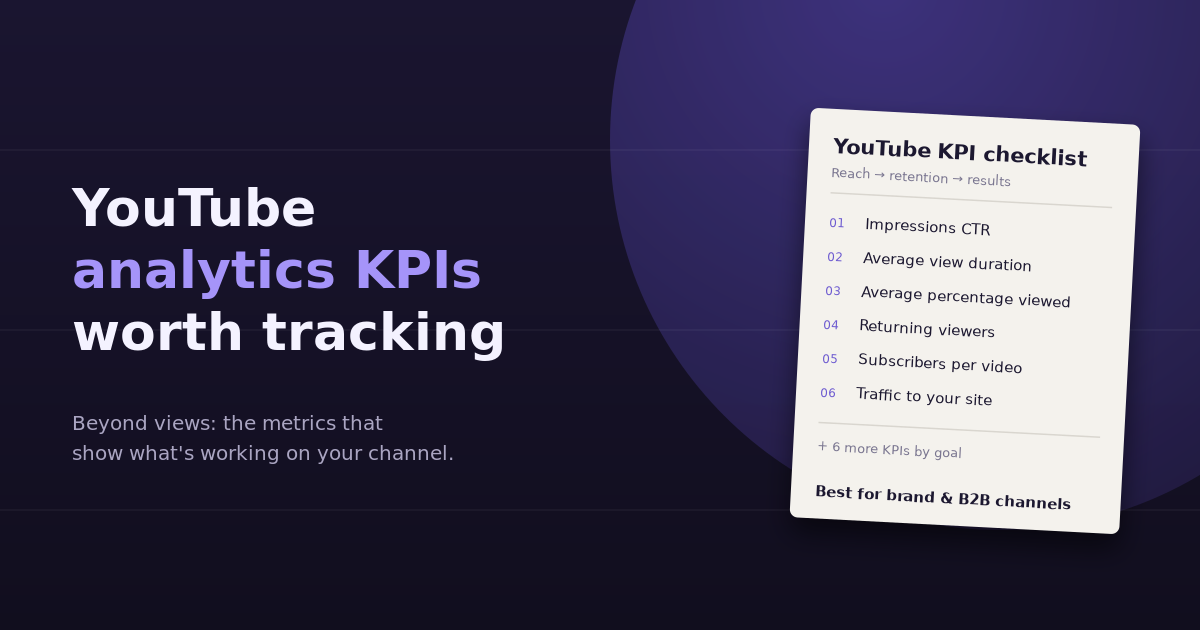
View count is the number everyone looks at first and the one that says least about whether a YouTube channel is working. A video can collect thousands of views from people who leave after ten seconds, while another with a fraction of the views brings in subscribers, site visits, and leads. The YouTube analytics KPIs worth tracking are the ones that explain why a video performs, how viewers behave, and whether the channel moves your business goals.
This guide covers twelve KPIs grouped by stage, reach, retention, engagement, and results, what each tells you, where to find it in YouTube Studio, and how to build a simple reporting routine around them.
The Four Stages of YouTube Performance
Every video goes through the same sequence: YouTube shows it to people (reach), they decide whether to watch and for how long (retention), some interact with it (engagement), and a few take an action you care about (results). A weak number at any stage limits everything after it, so KPIs work best read in that order.
Reach KPIs
1. Impressions
How many times your video thumbnails were shown to viewers on YouTube. Impressions tell you how much distribution YouTube is giving a video through search, suggestions, and the home feed. A sudden drop in impressions across the channel is often the first sign of a change in how YouTube is recommending your content.
2. Impressions click-through rate
The percentage of impressions that turned into views. This is the clearest measure of how well your title and thumbnail compete. Compare CTR between your own videos rather than against outside benchmarks, since it varies widely by niche, traffic source, and how broadly YouTube is showing the video.
3. Traffic sources
Where views come from: YouTube search, suggested videos, browse features, external sites, playlists, and channel pages. A channel dependent on search behaves differently from one driven by suggested videos, and each points to different optimization work.
Retention KPIs
4. Average view duration
The average length of time viewers watched a video. It’s the best single indicator of whether the video delivered on its title and thumbnail. YouTube’s recommendation systems pay close attention to whether viewers keep watching, so this metric heavily influences future reach.
5. Average percentage viewed
Average view duration as a share of the video’s length. It lets you compare a 4-minute and a 20-minute video fairly. A long video with a lower percentage viewed can still deliver more total watch time than a short one.
6. Audience retention curve
The graph showing what share of viewers are still watching at each moment. Look for three things: the drop in the first 30 seconds (the intro), sharp falls (moments where viewers lose interest), and bumps (sections people rewatch). The retention curve is the most practical tool for improving the next video.
Engagement KPIs
7. Returning viewers
Viewers who have watched your channel before. A healthy share of returning viewers means you’re building an audience, not just collecting one-off clicks. Track it alongside new viewers to see whether growth comes from new reach or from loyalty.
8. Subscribers gained per video
Net subscribers gained from each video, rather than the channel’s total subscriber count. It shows which topics and formats convert viewers into followers. Subscribers lost from a video is worth checking too; a spike can signal content that doesn’t match audience expectations.
9. Engagement actions
Likes, comments, and shares per view. Shares are especially valuable because they extend reach beyond YouTube. Comments provide qualitative insight: questions viewers ask often make good topics for the next video.
Results KPIs
10. Clicks to your website
For brand and B2B channels, this is often the KPI that matters most. Track clicks from descriptions, cards, end screens, and pinned comments using UTM-tagged links, then measure the resulting sessions in GA4, for example with utm_source=youtube&utm_medium=video&utm_campaign=[video-name].
11. Conversions from YouTube traffic
Key events in GA4, such as sign-ups, demo requests, or purchases, from YouTube-tagged sessions. This connects video performance to business outcomes and lets you compare YouTube with other channels on the same terms.
12. End screen and card click-through
How often viewers click the end screen elements and cards you add. These keep viewers on your channel or send them to your site, and a low rate usually means the call to action is weak or comes too late in the video.
KPIs by Channel Goal
| Channel goal | Primary KPIs | Supporting KPIs |
|---|---|---|
| Brand awareness | Impressions, views, unique viewers | Impressions CTR, shares |
| Audience growth | Subscribers gained per video, returning viewers | Average view duration, retention curve |
| Education and authority | Average percentage viewed, watch time | Comments, returning viewers |
| Lead generation (B2B) | Clicks to website, conversions in GA4 | End screen CTR, traffic from YouTube search |
| Ecommerce | Conversions and revenue from YouTube traffic | Clicks to product pages, retention on product videos |
Where to Find These in YouTube Studio
- Overview tab: views, watch time, subscribers, and top content
- Content tab: impressions, impressions CTR, views, average view duration, and traffic sources by video
- Audience tab: returning vs new viewers, unique viewers, and when your audience is on YouTube
- Advanced mode: detailed breakdowns by video, traffic source, geography, device, and date, with comparisons
Website clicks and conversions live in GA4, not YouTube Studio, which is why UTM tagging matters.
A Simple Reporting Routine
- 48 hours after publishing: impressions CTR and average percentage viewed against your channel’s recent averages
- Weekly: top videos by watch time, subscribers gained, and website clicks
- Monthly: traffic source mix, returning viewer share, and conversions from YouTube in GA4
- Quarterly: which topics and formats drove the most subscribers and conversions, to shape the next content plan
For the broader metrics framework this fits into, see our guide to content marketing metrics, and for how YouTube sits alongside other platforms, our breakdown of social media KPIs. The distinction in our reach vs impressions guide also applies directly to YouTube’s unique viewers and impressions.
Frequently Asked Questions
What is the most important YouTube analytics KPI?
It depends on your goal, but average view duration is the most useful single indicator of video quality, because it shows whether viewers stayed and strongly influences how widely YouTube recommends the video. For business channels, clicks and conversions from YouTube traffic matter most.
What is a good impressions click-through rate on YouTube?
There's no universal benchmark, because CTR varies by niche, traffic source, and how broadly YouTube shows a video. Compare each video's CTR against your channel's own recent average rather than against outside figures.
How do I track YouTube traffic to my website in GA4?
Use UTM-tagged links in video descriptions, pinned comments, and cards, such as utm_source=youtube and utm_medium=video. GA4 will then attribute those sessions and their key events to YouTube and to individual videos.
What's the difference between average view duration and average percentage viewed?
Average view duration is the average time watched, in minutes and seconds. Average percentage viewed expresses that time as a share of the video's total length, which makes it easier to compare videos of different lengths.
Why are my YouTube impressions dropping?
Falling impressions usually mean YouTube is recommending your videos less, often because recent videos had lower CTR or retention than earlier ones. Check traffic sources to see whether the drop is in search, suggested videos, or browse features.
Are subscribers a good YouTube KPI?
Total subscriber count is a weak KPI on its own, since many subscribers don't watch new videos. Subscribers gained per video and returning viewers are more useful, because they show which content builds a loyal audience.
Tie your videos to business results. Connect YouTube and GA4 to ConvoData and ask which videos drive website visits and conversions, not just views, then plan the next upload around the answer. Plans start at $39/month.