


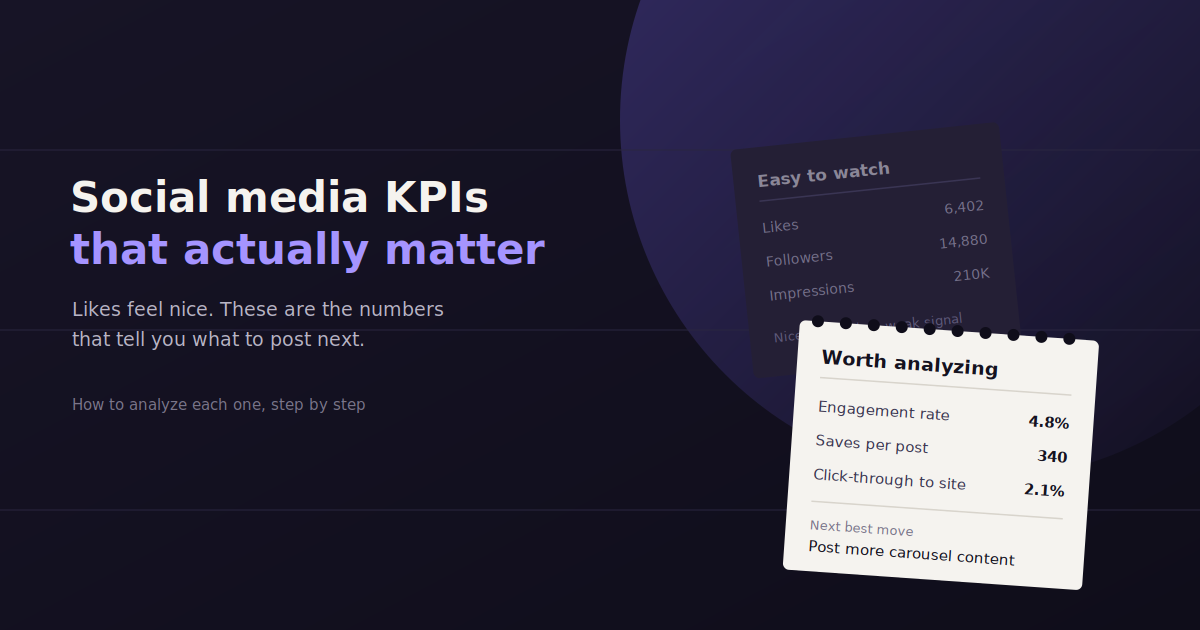
Social media KPIs are the specific, measurable metrics a team tracks to judge whether social activity is actually contributing to the business, rather than just producing likes and impressions that look nice in a screenshot.
The hard part isn’t finding social media metrics — every platform hands you dozens for free. The hard part is knowing which ones are worth building a habit around, and which are quietly wasting everyone’s time in the monthly review.
This guide breaks down the social media KPIs worth tracking by category, explains what each one actually tells you, and covers how to turn a KPI dashboard into decisions instead of just a wall of numbers.
Why Social Media KPIs Matter More Than Raw Numbers
A follower count or a like total tells you almost nothing on its own. It’s only useful next to a prior period, a goal, or a competitor benchmark — which is exactly what a KPI is supposed to provide and a raw number isn’t.
Social platforms also make it easy to optimize for the wrong thing. A post can generate huge reach and zero business value, or modest reach and a disproportionate number of leads. KPIs chosen around business outcomes catch that difference; vanity metrics don’t.
The goal isn’t to track every number a platform’s analytics tab offers. It’s to pick the handful that actually move the needle for this specific account, and analyze them consistently enough to notice when something changes.
Engagement KPIs
Engagement KPIs measure how actively an audience interacts with content — likes, comments, shares, saves, and clicks relative to the number of people who saw it — and are usually the fastest signal of whether content is actually resonating.
Engagement metrics answer a simple question: of the people who saw this content, how many did something with it? A high view count with low engagement usually means the content reached people but didn’t land.
Engagement rate — total engagements (likes, comments, shares, saves) divided by followers or impressions. This is the single most-cited social KPI because it normalizes for audience size, making it comparable across accounts of different scale.
Comments — a heavier-weight action than a like, and often a better signal of genuine interest since it takes more effort from the viewer.
Shares and reposts — the clearest sign that content resonated enough for someone to put their own name next to it.
Saves — particularly meaningful on platforms like Instagram, where a save signals someone plans to return to the content later.
Click-through rate — the percentage of viewers who clicked a link, showing whether content is driving traffic somewhere that matters, not just sitting inside the platform.
Reach and Awareness KPIs
Reach and awareness KPIs — impressions, reach, and share of voice — measure how many people saw content and how a brand’s visibility compares to competitors, useful for brand-building goals but weak on their own without an engagement or conversion metric alongside them.
Reach metrics matter for brand-building goals, but they’re the category most prone to becoming vanity metrics if tracked in isolation. Always pair them with an engagement or conversion number.
Reach — the number of unique accounts that saw a piece of content, distinct from impressions, which count every view including repeats.
Impressions — total views, including the same person seeing a post multiple times. Useful for gauging overall exposure, less useful for gauging actual interest.
Share of voice — how much of the conversation in a given category or hashtag belongs to your brand versus competitors, a useful gauge of relative visibility over time.
Brand mention volume — how often people talk about the brand organically, including tags and untagged mentions where tools support that tracking.
Growth KPIs
Growth KPIs track audience expansion over time — follower count, follower growth rate, and audience quality — and are most useful as trend lines rather than single snapshots, since a raw follower count says little without a growth rate attached.
Growth metrics get the most attention because they’re the easiest to screenshot and the easiest to misread. A raw follower count is close to meaningless without a growth rate and some sense of audience quality attached to it.
Follower growth rate — net new followers as a percentage of total followers over a given period, which is far more useful than a raw follower count for spotting momentum shifts.
Follower count — still worth tracking as a baseline, but should never be the headline metric in a report on its own.
Audience quality signals — things like follower-to-engagement ratio, which flag when growth is coming from bot activity or low-relevance audiences rather than genuine interest.
Unfollow rate — an underused metric that flags when specific content types are actively pushing existing followers away, not just failing to attract new ones.
Conversion and Business-Impact KPIs
Conversion KPIs connect social activity to business outcomes — leads, sales, cost per lead, and social-driven website traffic — and are the category most likely to justify a social budget in front of leadership, since they tie directly to revenue rather than visibility.
This is the category that actually justifies a social media budget in front of leadership, since it ties activity back to revenue rather than visibility.
Conversion rate — the percentage of social-driven visitors who complete a desired action, like a signup or a purchase.
Leads generated — the count of qualified leads attributable to social channels, typically tracked through UTM parameters or platform lead-gen forms.
Cost per lead / cost per acquisition — especially relevant for paid social, showing whether ad spend on a platform is producing results efficiently.
Social-driven traffic — sessions on the website originating from social platforms, visible in Google Analytics when links are properly tagged.
Return on ad spend (ROAS) — for paid social specifically, revenue generated per dollar spent, the clearest bottom-line KPI for a paid campaign.
Customer Loyalty and Retention KPIs
A smaller but still valuable category, these KPIs track how well social channels support customers who already know the brand, rather than acquiring new ones.
Response rate and response time — how often and how quickly a brand replies to comments and messages, a direct signal of customer service quality on social.
Sentiment — the ratio of positive to negative mentions, often tracked through social listening tools rather than a platform’s native analytics.
Repeat engagement — the same followers interacting across multiple posts over time, suggesting a genuinely loyal audience rather than one-off viral reach.
How to Choose Which Social Media KPIs to Track
Choosing social media KPIs means matching the metric category to the campaign goal — engagement for content quality, reach for brand awareness, growth for audience building, conversions for revenue — rather than tracking every available number across every category at once.
Not every account needs KPIs from every category above. The right set depends entirely on what the social presence is actually trying to accomplish this quarter.
A brand-awareness campaign should lean on reach and share of voice. A lead-gen push should lean on conversion metrics and mostly ignore follower growth. Mixing goals without separating the KPIs that track them tends to produce reports nobody can act on.
| Goal | Primary KPI Category | Example Metrics |
|---|---|---|
| Build Brand Awareness | Reach | Reach, impressions, share of voice |
| Improve Content Quality | Engagement | Engagement rate, comments, saves |
| Grow the Audience | Growth | Follower growth rate, unfollow rate |
| Drive Revenue | Conversion | Leads, cost per lead, ROAS |
| Strengthen Customer Relationships | Loyalty | Response time, sentiment, repeat engagement |
How to Analyze Social Media KPIs Without Getting Lost in Data
Compare against a prior period, not just an absolute number. A 4% engagement rate means little without knowing whether last month’s was 3% or 6%.
Watch trend direction over single data points. One low-performing week rarely means much; three consecutive low weeks is a pattern worth investigating.
Segment by content type. Aggregate engagement across a whole account hides which specific formats — video, carousels, single images — are actually driving the numbers.
Tie at least one KPI back to revenue. Even a rough attribution model keeps the whole KPI set anchored to business impact instead of drifting toward vanity metrics.
Avoid manual spreadsheet tracking where possible. Pulling numbers by hand from five platforms every week is exactly the kind of repetitive work that introduces errors and eats time better spent on strategy.
How Social Media KPIs Differ by Platform
The most meaningful KPI shifts by platform: Instagram and TikTok reward saves and watch time, LinkedIn rewards comments and dwell time on professional content, and X/Twitter still leans heavily on reposts and reply volume as a measure of reach beyond the original audience.
Treating every platform’s engagement rate as directly comparable is a common mistake, since each platform’s algorithm rewards different behaviors, which shifts which KPI actually reflects strong performance.
Instagram and TikTok
Saves and watch time (or average view duration for video) tend to matter more here than likes, since both platforms weight them heavily in distribution decisions.
A video with a modest like count but strong average watch time is often outperforming a video with more likes and a low completion rate, even though the like count looks better at a glance.
Comments and dwell time carry unusual weight on LinkedIn compared to other platforms, since the platform’s distribution model rewards content that keeps people reading rather than scrolling past.
For B2B accounts, click-through rate to a company website is also worth tracking closely, since LinkedIn audiences skew toward higher purchase intent than most other social channels.
X (Twitter)
Reposts and reply volume remain the clearest signal of a post reaching beyond its original audience, functioning similarly to how shares work on other platforms.
Link click-through rate is also worth isolating separately here, since X’s feed format makes it easy for a post to generate high impressions without much of that traffic ever leaving the platform.
Organic reach has declined steadily on Facebook for years, which makes paid metrics like cost per click and ROAS more central to Facebook KPI tracking than they are on platforms with stronger organic distribution.
Video completion rate and page-level engagement rate are still worth tracking for content strategy, but they should be read alongside paid performance rather than in isolation.
Where Conversational Tools Fit Into Social Media KPI Tracking
Even with the right KPIs chosen, the actual analysis step — comparing this month’s engagement rate against last month’s across five platforms — is where most teams lose time to manual exports and spreadsheet-building.
Conversational tools like ConvoData skip that manual step. Instead of pulling engagement numbers from each platform separately, you ask a plain-English question — “which of our posts had the highest engagement rate last month” — and get a live answer pulled from your connected accounts, along with a suggested next step rather than just a chart to interpret yourself.
That’s a meaningfully different workflow than building and maintaining a social media dashboard, which still requires someone to design the layout and keep checking it for the answer to show up on its own.
ConvoData supports 14 live integrations today as part of a 27-integration roadmap that’s growing regularly, and starts at $39/month, which is worth checking against your current platform mix before committing to a full dashboard rebuild.
Frequently Asked Questions
What are the most important social media KPIs to track?
Engagement rate, follower growth rate, and a conversion metric like leads or cost per lead cover the three most common goals — content quality, audience growth, and business impact. Beyond those three, the right additional KPIs depend on the specific campaign goal.
What's the difference between reach and impressions?
Reach counts unique accounts that saw a piece of content. Impressions count total views, including the same account seeing it multiple times. A post can have high impressions and comparatively low reach if it's shown repeatedly to a smaller audience.
Is follower count a good social media KPI?
On its own, not really — a raw follower count says little without a growth rate and some sense of audience quality attached. It's worth tracking as a baseline, but shouldn't be the headline metric in a performance report.
How do you measure ROI on social media?
The most direct approach ties social-driven traffic and conversions back to revenue using UTM-tagged links and a defined attribution model, then compares that revenue against the cost of running the channel, including ad spend and content production time.
What are vanity metrics in social media?
Vanity metrics are numbers that look impressive but don't clearly connect to a business outcome — raw impressions or follower counts are common examples. They're not useless, but they should never be the only KPI a team tracks.
How often should social media KPIs be reported?
Weekly tracking works well for fast-moving metrics like engagement rate and paid campaign performance, while growth and loyalty metrics are usually meaningful enough to review monthly or quarterly.
If pulling social KPIs across platforms every week is eating time your team could spend on strategy, ConvoData lets you ask for the numbers in plain English and get a live answer plus a next step — plans start at $39/month.
If Facebook is a core channel, our dedicated breakdown of 15 Facebook metrics worth tracking goes deeper than the platform-agnostic view here. And once you are comfortable with which KPIs matter, our guide to social media data mining covers how to pull deeper audience and content insights out of the same data.