


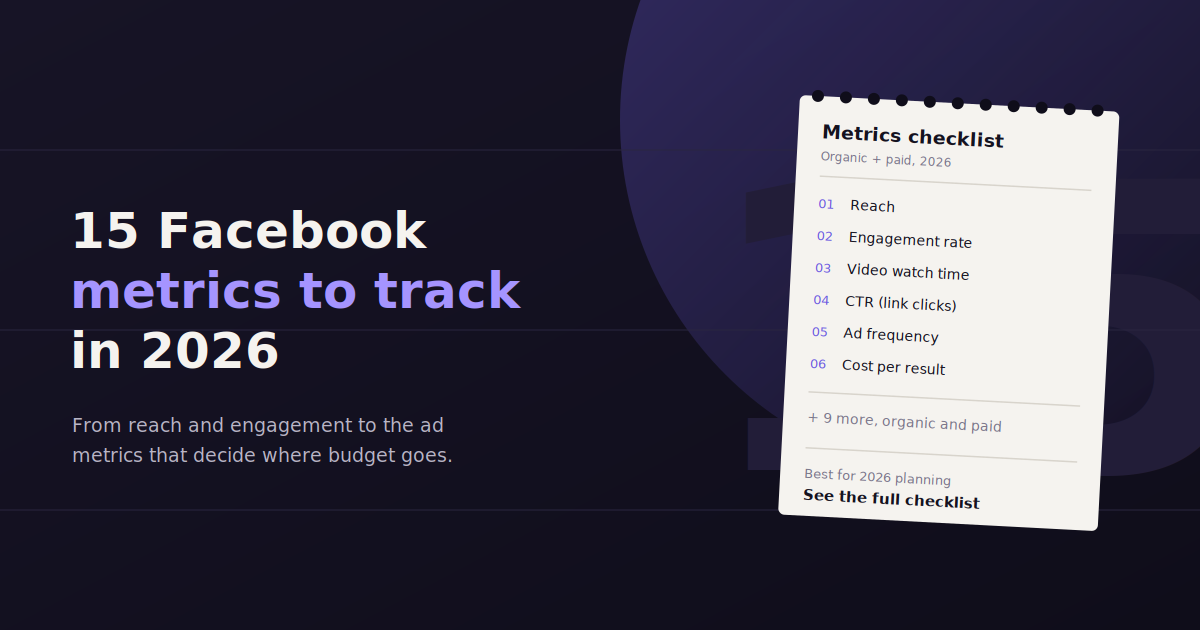
Facebook’s ads dashboard surfaces dozens of numbers, and most of them don’t matter for your specific goal.
These 15 Facebook metrics cover the ones that actually explain performance — split into audience reach, cost efficiency, and conversion outcomes — so you can skip the noise.
For each one, you’ll see what it measures, why it matters, and what a healthy range generally looks like.
If you’re tired of pulling these numbers by hand every week, a conversational tool like ConvoData can answer questions about them directly instead.
Audience and Reach Metrics
Reach and impressions measure how many people saw your content and how often — reach counts unique viewers, impressions count total views including repeats, and the ratio between them (frequency) shows how saturated your audience is becoming.
1. Reach
The number of unique people who saw your post or ad at least once. Rising reach with flat engagement usually means you’re hitting a broader but less relevant audience.
2. Impressions
The total number of times your content was displayed, including repeat views by the same person. Impressions will always be equal to or higher than reach.
3. Frequency
Impressions divided by reach — how many times, on average, each person saw your ad. Frequency climbing above 3-4 within a short window often signals ad fatigue setting in.
4. Follower Demographics
Age, gender, and location breakdown of your audience — critical for checking whether your actual followers match your intended target before you scale spend.
5. Share of Voice
Your brand’s visibility relative to competitors on the platform — useful context for whether a slow month is a you-problem or a category-wide trend.
Engagement Metrics
6. Engagements
Total interactions — likes, comments, shares, clicks — on a piece of content. It’s the broadest engagement number but least specific about what people actually did.
7. Engagement Rate
Engagements divided by reach or impressions, expressed as a percentage. This normalizes engagement so you can fairly compare a small post to a big one.
8. Video Average Watch Time
How long people watch before dropping off. A steep drop in the first few seconds usually points to a weak hook, not a bad topic.
9. Page Likes and Followers
Total audience size over time. Useful for tracking growth, but a weak signal on its own — a large, disengaged following is worth less than a smaller, active one.
10. Referral Traffic From Facebook
Sessions your website receives that originated from Facebook, tracked through GA4 or a similar analytics tool — the bridge metric connecting social activity to actual site behavior.
Cost and Conversion Metrics
For paid Facebook campaigns, the metrics that determine profitability are click-through rate, cost per click, CPM, cost per action, and conversion rate — together they show whether your ad spend is translating into results efficiently.
11. Click-Through Rate (CTR)
The percentage of people who clicked after seeing your ad. Low CTR with strong reach usually means the creative or offer isn’t compelling, not that the audience is wrong.
12. Cost Per Click (CPC)
What you pay, on average, for each click. Rising CPC over time in the same audience often signals creative fatigue or increased competition for that audience.
13. CPM (Cost Per 1,000 Impressions)
What you pay to reach 1,000 people, regardless of clicks. Useful for comparing raw audience cost efficiency across campaigns or time periods.
14. Cost Per Action (CPA)
What you pay for each specific conversion action — a purchase, a lead form, a sign-up. This is usually the number that determines whether a campaign is actually profitable.
15. Conversion Rate
The percentage of clicks that result in your desired action. A low conversion rate with a strong CTR usually points to a landing page problem, not an ad problem.
How These Metrics Work Together
No single metric tells the full story on its own — the useful insight almost always sits in how two of them relate.
High reach with low engagement rate suggests the content reached the wrong audience, or the creative isn’t compelling enough to act on. High CTR with low conversion rate points to a landing page problem, not an ads problem. Rising frequency with flat CTR is the clearest early signal of ad fatigue.
Building the habit of checking pairs of metrics, not single numbers in isolation, is what separates a useful weekly review from a vanity metrics report.
Benchmarks: What “Good” Looks Like
Facebook benchmarks vary significantly by industry and objective, but as rough starting points: engagement rate of 1-5% is healthy for organic content, CTR above 1% is solid for most paid campaigns, and frequency above 3-4 within a short window often signals fatigue setting in.
Treat any published benchmark as a starting reference, not a target — your own account’s historical performance is a more reliable baseline than an industry-wide average, since audience and offer quality vary enormously.
The more useful practice is tracking your own trend line over time and investigating any metric that moves sharply outside its normal range, rather than chasing a generic external number.
Matching Facebook Metrics to Funnel Stage
Not all 15 metrics deserve equal attention at every point in the customer journey — which ones matter most shifts as a prospect moves from first seeing your brand to actually buying from it.
Organizing metrics by funnel stage makes it easier to diagnose a problem quickly, since a weak number at the top of the funnel needs a different fix than a weak number near the bottom.
Top of funnel (awareness) — reach, impressions, frequency, share of voice. The question here is whether the right people are seeing your content at all.
Middle of funnel (consideration) — engagement rate, video watch time, CTR. The question shifts to whether people who saw it found it compelling enough to act.
Bottom of funnel (conversion) — conversion rate, CPA, referral traffic quality. Here the question is whether interest is actually translating into the outcome you’re paying for.
Retention (post-conversion) — follower growth quality, repeat engagement from existing customers, referral traffic from returning visitors.
Setting Up a Facebook Metrics Tracking Routine
Tracking 15 metrics well requires more structure than checking Ads Manager whenever you happen to think of it — a lightweight routine catches problems while they’re still small.
A simple weekly structure works for most teams: five minutes on Monday to note the previous week’s core numbers, a mid-week check specifically on frequency and CPA for active paid campaigns, and a slightly longer Friday review that compares the week against the prior one and flags anything worth digging into before the next reporting cycle.
The specific cadence matters less than consistency — a team that checks the same metrics the same way every week catches drift faster than one that only looks closely once a month during report-building.
Monday: log last week’s core numbers — reach, engagement rate, CPA, conversion rate.
Mid-week: spot-check frequency and CPC on active campaigns specifically, since these shift fastest.
Friday: compare the full week against the prior week and flag any metric that moved more than 15-20%.
Common Mistakes When Tracking Facebook Metrics
Most metric-tracking mistakes aren’t about picking the wrong numbers — they’re about how those numbers get read and compared.
A few show up repeatedly across accounts of every size:
Comparing metrics across different objectives. A CPA from an awareness campaign and a CPA from a conversion campaign aren’t measuring the same thing, even though they use the same label.
Reacting to daily noise. Facebook metrics naturally fluctuate day to day — a single bad day rarely means anything on its own; a multi-day trend does.
Ignoring metric pairs. Looking at CTR alone, without conversion rate next to it, hides whether a click problem or a landing page problem is the real issue.
Not segmenting by placement. Feed, Stories, and Reels often perform very differently on the same metric — a blended number can mask a placement that’s quietly dragging down the average.
Forgetting seasonal context. A CPM spike every November is competitive pressure from holiday advertisers, not a sign your account suddenly got worse.
How to Track These Metrics Without Manual Exports
Facebook’s native Ads Manager and Meta Business Suite cover all 15 metrics natively, but pulling them into a client report each month usually means manual exports or a dedicated reporting tool.
A conversational tool like ConvoData can answer a direct question about any of these metrics — “what was our CPA on the retargeting campaign last week” — pulled live from your connected Facebook Ads account, plus a suggested next step if the number looks off.
This matters most for the metrics that need frequent checking, like frequency and CPA, where waiting for a scheduled monthly report means catching a problem weeks after it started costing money. Being able to ask a specific question the moment something looks off — rather than opening Ads Manager, filtering to the right date range, and building a custom column view every time — is what actually keeps a weekly tracking routine sustainable instead of something that quietly stops happening after a few busy weeks.
For agencies managing this across multiple client accounts, the same principle applies at scale: instead of rebuilding the same 15-metric column view in every client’s Ads Manager account, connecting each account once and asking the same question across all of them turns a repetitive manual task into a two-minute check.
Facebook is just one piece of a broader social presence, so it is worth zooming out to our guide on the social media KPIs that actually matter across every platform you run. If collecting this data consistently is still a manual chore, our complete guide to social media data collection covers how to set that up properly.
Frequently Asked Questions
What is the most important Facebook metric to track?
It depends on your goal — cost per action (CPA) matters most for direct-response campaigns, while reach and engagement rate matter more for brand awareness campaigns.
What's a good engagement rate on Facebook?
Engagement rates vary widely by industry and content type, but 1-5% is a commonly cited healthy range for organic posts; paid content benchmarks differ and depend heavily on campaign objective.
What's the difference between reach and impressions?
Reach counts unique people who saw your content once; impressions count every view, including repeat views by the same person — impressions are always equal to or greater than reach.
How often should I check Facebook ad metrics?
Weekly at minimum for active campaigns, since cost metrics like CPC and CPA can shift quickly enough that a monthly-only check risks missing budget waste.
Which Facebook metrics matter most at each funnel stage?
Reach, impressions, and frequency matter most at the top of the funnel; engagement rate and CTR matter most in the middle; conversion rate and CPA matter most at the bottom. Tracking the wrong stage's metrics for a given campaign objective is a common source of misread performance.
Should I compare my Facebook metrics against industry benchmarks?
Use benchmarks as a rough starting reference only. Your own account's historical trend is a far more reliable signal than an industry average, since audience quality, offer strength, and creative all vary too much for a generic benchmark to apply precisely.
Why do my Facebook metrics look different by placement?
Feed, Stories, and Reels have different user behaviors and ad formats, so metrics like CTR and engagement rate often vary significantly between them. A blended, unsegmented number can hide a placement that's underperforming and dragging down the overall average.
How many Facebook metrics should a weekly report actually include?
Five to seven is usually enough for a working weekly check — enough to cover reach, engagement, and cost efficiency without burying the numbers that matter under ones that don't. Save the full 15-metric view for monthly deep-dives or troubleshooting a specific problem.
Connect your Facebook Ads account to ConvoData and ask it which of these 15 metrics needs attention this week — plans start at $39/month.