


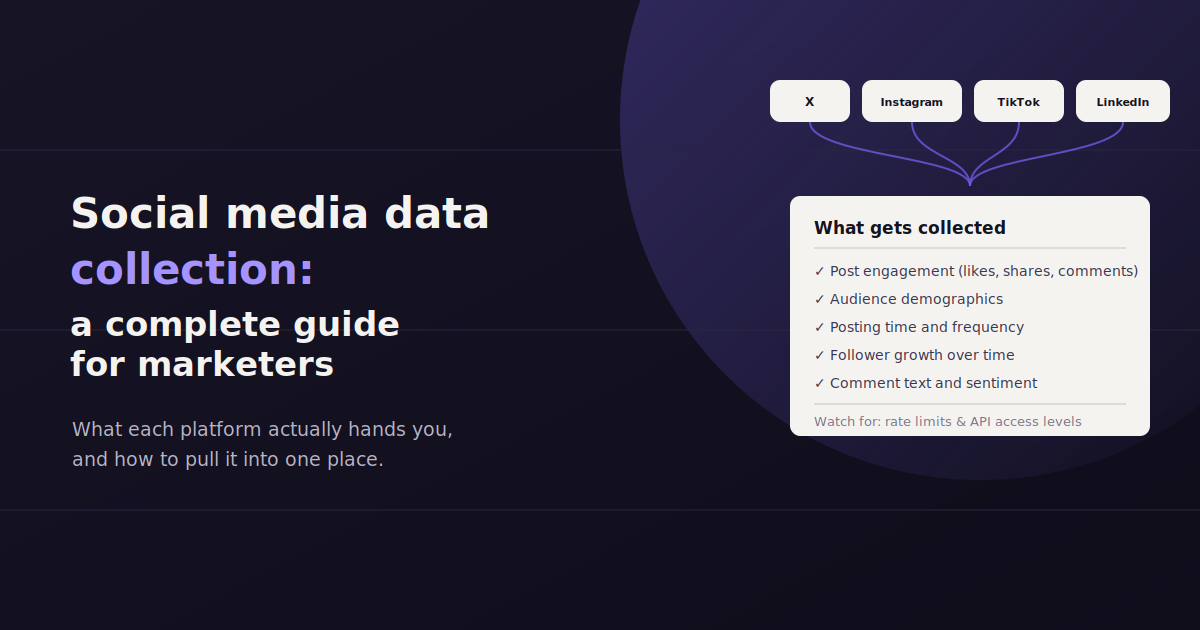
Every post, comment, and click on a social platform generates data — but collecting it in a form you can actually report on is a different problem than the platform’s native app dashboard solves.
Social media data collection is the process of gathering, organizing, and centralizing performance and audience data from platforms like Instagram, Facebook, LinkedIn, TikTok, and X so marketers can measure results and make decisions.
Done well, it turns scattered engagement numbers into a clear picture of what content works, who’s actually seeing it, and where budget should move next.
This guide covers the methods, data types, tools, and compliance basics marketers need to collect social data properly — and how to turn that raw data into reporting your team and clients can actually use.
What Is Social Media Data Collection?
Social media data collection is the practice of gathering performance, audience, and content data from social platforms — through native analytics, APIs, or third-party tools — and organizing it into a usable format for analysis and reporting.
At its simplest, it means pulling numbers out of a platform’s analytics tab. At its most useful, it means automatically syncing that data into a system where you can compare it across platforms, track it over time, and connect it to business outcomes like leads or revenue.
Marketers collect this data for a handful of core reasons: to prove campaign performance to a client or leadership, to understand audience behavior well enough to plan future content, and to catch problems — a sudden drop in reach, a spike in negative sentiment — before they become bigger issues.
The challenge isn’t usually getting the data. Most platforms hand it over freely. The challenge is getting it into one place, in a consistent format, without spending hours every week on manual exports.
Types of Social Media Data Worth Collecting
The core categories of social media data are engagement (likes, comments, shares), reach and impressions, audience demographics, sentiment, and conversion data — each answering a different question about how content is performing.
Not all social data matters equally for every goal. A brand-awareness campaign cares about reach and impressions; a lead-gen campaign cares about click-throughs and conversions. Knowing which category answers which question keeps reporting focused instead of bloated with vanity metrics.
Engagement Data
Likes, comments, shares, saves, and reactions all fall under engagement — the clearest signal of whether content resonated with the people who saw it.
Engagement rate (engagement divided by reach or followers) is usually more useful than raw counts, since it normalizes for audience size and lets you compare a small account’s performance fairly against a larger one.
Reach and Impressions
Reach counts unique accounts that saw a post; impressions count total views, including repeat ones. Both matter, but they answer different questions — reach tells you about audience size, impressions tell you about frequency.
A high impressions-to-reach ratio usually means the same people are seeing a post repeatedly, which can be a sign of strong algorithmic favor or, in paid campaigns, ad frequency creeping too high.
Audience Demographics
Age, gender, location, and device data help confirm whether content is actually reaching the intended audience, not just performing well in aggregate.
Most native platform dashboards provide this at an account level rather than a per-post level, which is a useful benchmark to revisit monthly rather than something to check after every single post.
Sentiment Data
Sentiment looks at the tone of comments and mentions — positive, negative, or neutral — rather than just the volume of engagement.
It’s harder to collect automatically than click-based metrics, since it usually requires either manual review or a natural-language tool trained to classify text, but it catches problems that raw engagement counts miss entirely, like a post that’s generating a lot of comments for the wrong reasons.
Conversion and Click Data
Link clicks, landing page visits, and downstream conversions connect social activity to actual business outcomes, not just platform-native engagement.
This data usually requires pairing social platform data with a web analytics tool like Google Analytics, since platforms rarely track what happens after someone leaves the app.
Methods for Collecting Social Media Data
Marketers collect social media data through three main methods: native platform analytics, platform APIs pulled into a reporting tool, and manual exports — each with different tradeoffs in speed, depth, and scalability.
Which method makes sense depends mostly on how many accounts you manage and how often you need updated numbers.
Native Platform Analytics
Every major platform includes built-in analytics — Instagram Insights, Facebook Page Insights, LinkedIn Analytics, TikTok Analytics, and X’s native dashboard.
These are free, accurate, and the fastest way to check a single account’s numbers, but they’re siloed. Comparing performance across five platforms means opening five separate dashboards and doing the math yourself.
Platform APIs
Most platforms expose an API that lets approved apps pull the same data shown in native dashboards, programmatically and on a schedule.
This is how most third-party reporting and social management tools work under the hood — they handle the API connections so you don’t have to build and maintain them yourself.
APIs are the backbone of any multi-platform reporting setup, since they’re the only reliable way to pull consistent, comparable data across accounts without manual copying.
Manual Export and Spreadsheet Tracking
Downloading a CSV from each platform and pasting numbers into a spreadsheet still works for a single small account, but it doesn’t scale past a handful of profiles.
It’s also the most error-prone method — a mistyped number or a missed monthly export is easy to catch too late, right before a client meeting.
Native Analytics vs. Third-Party Tools
Native platform analytics are free and accurate for single-account checks, but third-party tools centralize data across platforms, retain longer history, and automate the reporting layer that native dashboards don’t provide.
Native analytics are the source of truth — third-party tools don’t invent new data, they aggregate and present what the platform APIs already expose. The value they add is centralization, history, and automation.
Most native dashboards only retain 90 days to two years of history, and only for the current login. If you manage accounts for multiple clients or brands, a third-party layer is close to mandatory just to avoid logging into a dozen separate accounts every week.
For marketers running paid campaigns, the same logic applies to ad performance. A tool like ConvoData pulls connected social and ad account data together and lets you ask a plain-English question — like which posts drove the most link clicks this month — rather than manually cross-referencing multiple native dashboards yourself.
Native analytics: free, real-time, accurate, but siloed to one platform and one login.
Third-party tools: centralize multiple accounts, retain longer history, automate scheduled reporting, and often add cross-platform comparison or AI-driven analysis.
Privacy and Compliance Basics
Social media data collection is generally compliant when it relies on aggregate, platform-provided analytics rather than scraping individual user profiles — but marketers should still respect platform terms of service, regional privacy laws, and consent requirements for any first-party data they combine with social metrics.
Most of what marketers collect — reach, engagement, impressions, aggregate demographics — is anonymized and provided directly by the platform under its own terms of service, which makes it low-risk from a privacy standpoint.
The risk increases when data collection moves toward scraping individual profiles, collecting personal information from comments, or combining social data with first-party customer records. That’s where regulations like GDPR and CCPA start to matter directly.
A simple rule keeps most marketers on solid ground: use official APIs and approved tools rather than scraping, and never combine social platform data with personally identifiable customer information without a clear legal basis and consent.
Use official APIs, not scraping tools that violate a platform’s terms of service.
Stick to aggregate data for reporting purposes rather than tracking individual users across platforms.
Get consent before combining social engagement data with first-party customer records like email addresses.
Know your regional obligations — GDPR, CCPA, and similar laws apply if you’re collecting or storing data tied to identifiable individuals.
Common Pitfalls in Social Media Data Collection
Even experienced teams run into the same handful of mistakes when setting up a social data collection process.
Chasing vanity metrics. Follower counts and likes feel good to report but rarely correlate with business results — pair them with click-through and conversion data whenever the goal is more than brand awareness.
Inconsistent time frames. Comparing a 7-day window on one platform to a 30-day window on another produces reports that look like they’re improving or declining when they’re really just measuring different periods.
Ignoring platform algorithm changes. A sudden reach drop is sometimes a content problem and sometimes just a platform-wide algorithm shift — checking industry news before diagnosing your own content saves a lot of wasted troubleshooting.
Letting data go stale. A monthly export that sits untouched in a spreadsheet for three weeks before anyone looks at it defeats the purpose of collecting it in the first place.
Skipping context in reports. A number without a comparison — last month, last quarter, a campaign benchmark — tells a client almost nothing about whether performance is actually good.
Turning Collected Data Into Useful Reporting
Useful social media reporting goes beyond a metrics dump — it pairs each number with a comparison point, a plain-language explanation of what changed, and a recommended next step, which is what turns raw data collection into a decision-making tool.
Collecting the data is only half the job. The real value shows up when someone looks at a report and immediately understands what to do next, rather than staring at a chart wondering if the number is good or bad.
The best social reports answer three questions in order: what happened, why it happened, and what to do about it. Most collection tools stop at the first question and leave the other two to whoever is writing the report.
This is where a conversational approach changes the workflow. Instead of building a dashboard and hoping the right person notices the right trend, a tool like ConvoData lets you ask directly — “why did engagement drop on Instagram last week” — and get an answer pulled from your connected data along with a suggested next step, cutting out the manual analysis step entirely.
Pair every number with a comparison — week over week, month over month, or against a campaign goal.
Segment by content type so you know whether video, carousels, or static posts are actually driving results.
Track trend lines, not snapshots — a single week rarely tells the full story on its own.
Automate the recurring pulls so reporting happens on schedule instead of depending on someone remembering to run it.
Once your data collection is solid, the next step is usually going deeper into what it is actually telling you — see our guide to social media data mining for that. And if you have not settled on which numbers to prioritize once the data is flowing, our breakdown of the social media KPIs that actually matter is a good next read.
Frequently Asked Questions
What is social media data collection?
It's the process of gathering performance, audience, and content data from social platforms — through native analytics, platform APIs, or third-party reporting tools — and organizing it so marketers can measure results and make decisions.
Is it legal to collect social media data for marketing purposes?
Yes, when it's collected through official APIs and platform-provided analytics rather than scraping. Aggregate performance data is generally low-risk, but combining it with personally identifiable customer information requires consent and awareness of laws like GDPR and CCPA.
What's the difference between reach and impressions?
Reach counts the number of unique accounts that saw a post, while impressions count total views including repeat views from the same account. A high impressions-to-reach ratio usually means the same audience is seeing content repeatedly.
Do I need a third-party tool if I only manage one social account?
Not necessarily — native analytics are free and accurate for a single account. Third-party tools become more valuable once you're managing multiple accounts or platforms and need centralized, comparable reporting.
How often should social media data be collected and reported?
Weekly checks catch problems early, while monthly reporting is standard for stakeholder or client updates. High-spend paid campaigns often warrant daily monitoring for the first week after launch.
What social media data actually matters for reporting?
It depends on the goal — engagement rate and reach for brand awareness, click-through and conversion data for lead generation, and sentiment data for reputation-sensitive campaigns. Avoid reporting every available metric just because it's collectible.
Collecting social media data is only useful if someone actually acts on it. ConvoData connects to your social and ad accounts and lets you ask plain-English questions about performance, then returns a live answer plus a suggested next step — starting at $39/month.