


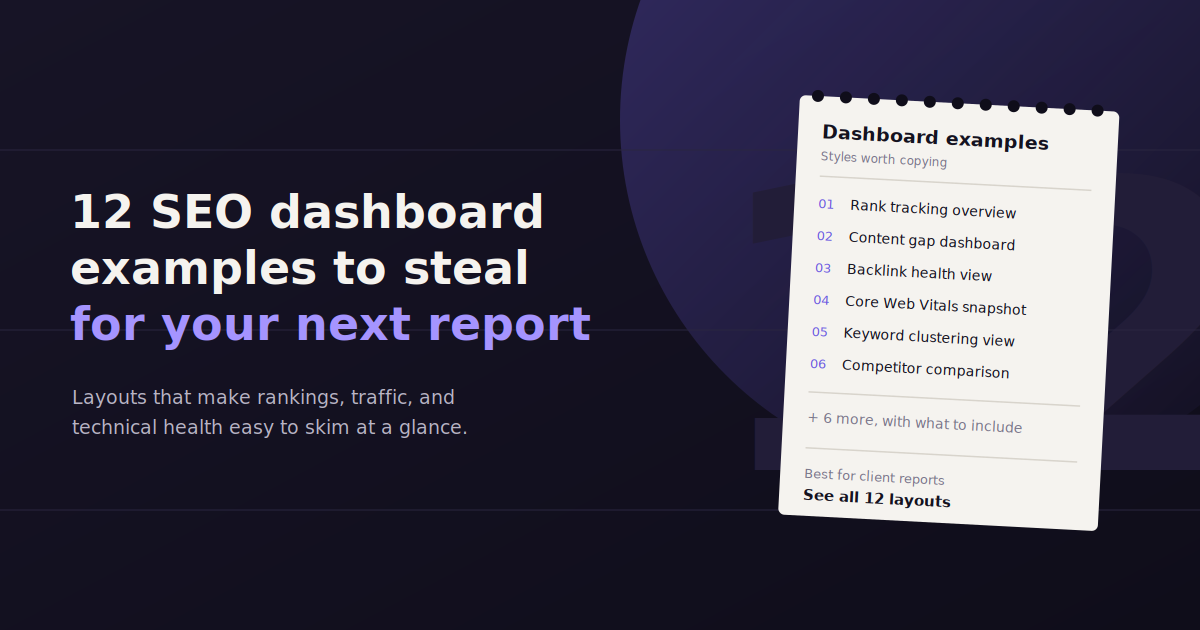
A good SEO dashboard proves the work is paying off in under 30 seconds. A bad one is a wall of numbers nobody reads past the first row.
These SEO dashboard examples cover the layouts agencies and in-house teams actually use — performance, rankings, client reporting, and the newer category of AI-search traffic.
One entry on this list isn’t a dashboard at all: ConvoData replaces the fixed layout with a conversational interface, where you ask a question and get a live answer plus a recommendation.
Copy the layout that matches what you’re trying to prove, then adjust the specific metrics to your site or client.
What Should an SEO Dashboard Include?
A solid SEO dashboard includes organic traffic trends, keyword ranking movement, click-through rate from Search Console, top landing pages, and at least one technical health metric — with month-over-month comparison, not just a single snapshot.
Organic traffic trend — sessions or users from organic search over time, not a single-month total.
Keyword ranking movement — which terms gained or lost position, not just an average rank.
Click-through rate — from Search Console, showing how well titles and snippets are converting impressions.
Top landing pages — which pages are actually earning the traffic.
Technical health — crawl errors, Core Web Vitals, or indexation issues that could be capping performance.
12 SEO Dashboard Examples by Use Case
1. The Conversational SEO Dashboard (ConvoData)
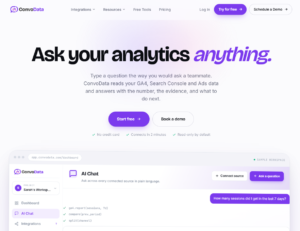
Instead of a fixed grid, ConvoData connects live to your SEO data and lets you ask direct questions — “which pages lost rankings this month and why” — and returns an answer plus a suggested fix.
It covers 14 live integrations today out of a 27-integration roadmap, and starts at $39/month. It works well paired with a traditional dashboard rather than replacing one outright, especially early on.
2. Comprehensive SEO Dashboard
A single view blending traffic, rankings, and technical health — the default for a monthly client check-in when you need the full picture on one page.
3. GEO Performance Dashboard
Tracks visibility in AI answer engines like ChatGPT, Perplexity, and Gemini alongside traditional search — an increasingly necessary addition as AI search traffic grows.
4. Local SEO Reporting Dashboard
Centers on Google Business Profile metrics — views, calls, direction requests — plus local pack rankings for location-based businesses.
5. Organic Traffic SEO KPI Dashboard
A focused view on sessions, users, and engagement from organic search only, useful when a stakeholder wants signal without channel noise.
6. Onsite SEO Dashboard
Covers technical health — indexation status, crawl errors, Core Web Vitals — the diagnostic layer that explains why traffic moved.
7. ChatGPT SEO Dashboard
Tracks brand mentions and citation frequency specifically within ChatGPT responses, a newer but fast-growing visibility metric.
8. Comprehensive Keyword Ranking Dashboard
Shows ranking distribution across position buckets (1-3, 4-10, 11-20) rather than just an average, which tells a more honest story about where the real opportunity sits.
9. Ahrefs / Semrush Ranking Dashboards
Pulled directly from a dedicated rank tracker, these give deeper competitive context — share of voice, competitor overlap — than Search Console alone provides.
10. Google Analytics SEO Dashboard
Blends GA4 behavior data — engagement rate, conversion events — with organic traffic to connect rankings to actual business outcomes.
11. SEO Analysis Dashboard
A diagnostic layout for identifying opportunity — pages ranking on page 2, high-impression low-CTR queries, content gaps — rather than just reporting results.
12. SEO Client Dashboard for Agencies
White-labeled, branded, and simplified to the 3-5 metrics a non-technical client actually cares about, with plain-language framing instead of SEO jargon.
Why Most SEO Dashboards Get Abandoned
An SEO dashboard nobody checks after month one usually tried to do too much — 30 metrics on one screen means no single number stands out as the one to watch.
The fix is picking one primary question the dashboard answers — is organic traffic growing, are we ranking for the terms that matter, is technical health stable — and building around that question instead of every metric a platform happens to offer.
The second common failure is stale data. A dashboard that refreshes weekly when rankings move daily will always feel a step behind, which quietly trains people to stop checking it. Once someone opens a dashboard twice and finds the same numbers as the last visit, they stop treating it as a live source and go back to asking for updates directly.
Choosing the Right SEO Dashboard for Your Situation
Match the dashboard to the audience: use a comprehensive or client dashboard for monthly stakeholder updates, an onsite or analysis dashboard for internal diagnostic work, and a conversational tool like ConvoData when the question changes every time you check in.
A monthly client update calls for the comprehensive or client dashboard format — broad enough to reassure, simple enough to read in two minutes.
Internal SEO teams doing diagnostic work get more value from the onsite or analysis dashboard formats, which surface problems rather than just results.
If the question you need answered changes every time you check in, a fixed dashboard will always feel one step behind — that’s exactly the gap a conversational tool is built to close.
How Often an SEO Dashboard Should Refresh
Rankings can move daily, so a dashboard that only pulls fresh data weekly will consistently feel a step behind what’s actually happening in search results.
Search Console and GA4 data typically update within a day or two of the actual activity, which sets a practical floor on refresh speed regardless of the visualization tool layered on top.
For most SEO use cases, a daily refresh is enough — real-time updates matter far more for paid media, where budget pacing decisions need to happen within hours, not days.
Mistakes That Make SEO Dashboards Hard to Trust
Mixing sampled and unsampled data on the same dashboard without labeling which is which leads to numbers that don’t reconcile, and a client or stakeholder will eventually notice.
Showing rank position as a single average across all tracked keywords hides more than it reveals — a term that moved from position 45 to 30 looks identical in an average to one that moved from 3 to 2, even though the second is far more valuable.
Failing to segment branded from non-branded traffic is another common blind spot — a spike in branded search often reflects marketing elsewhere, not SEO performance, and crediting it to SEO overstates the channel’s real impact.
SEO Dashboard vs. SEO Report: What’s the Difference
A dashboard is a live, always-current view meant to be checked repeatedly. A report is a static snapshot, finalized at a point in time, meant to be read once and archived. Confusing the two leads teams to build the wrong thing.
A dashboard should be built for someone who checks it weekly or more — it needs to stay accurate with minimal maintenance and answer the same handful of questions every time. A report, by contrast, gets written for a specific moment: the end of a quarter, a campaign wrap-up, a client renewal conversation — and it can include narrative context a dashboard doesn’t have room for.
The common mistake is building a report-style document — dense, narrative-heavy, finalized — and then expecting it to double as a live dashboard. It won’t get checked regularly because it wasn’t built to be, and stakeholders will keep asking for a fresher number that isn’t there yet.
The reverse mistake also happens: sending a live dashboard link as a monthly report with no narrative attached leaves the client staring at numbers with no framing for what changed or why. Most agencies end up maintaining both — a dashboard for ongoing visibility, a short report layered on top for the periodic narrative.
Segmenting SEO Dashboard Data: Device, Location, and Content Type
By device. Mobile and desktop search behavior differs enough — different SERP features, different click-through patterns — that a blended number can mask a real problem on one device that’s being offset by strength on the other.
By location. For any business serving multiple regions, a single national traffic number hides which markets are actually growing versus stagnant, especially relevant for local SEO and multi-location brands.
By content type. Blog content, product pages, and category pages typically have very different traffic and conversion patterns — segmenting them separately shows which content type is actually driving the SEO program’s results.
By branded vs. non-branded query. This is the segmentation most dashboards skip, and it’s the one most likely to mislead — branded search growth usually reflects other marketing, not SEO work, so keeping it separate from non-branded gives a cleaner read on organic performance specifically.
Building Your First SEO Dashboard: A Simple Starting Point
Start narrower than feels comfortable. Pick the comprehensive dashboard format, limit it to five metrics, and resist adding more until you’ve used it for a full reporting cycle.
Connect Search Console and GA4 first since they’re free and cover the core metrics — organic traffic, click-through rate, top pages, and ranking visibility trends — before layering in a paid rank tracker for deeper competitive detail. Only add a second data source once the first is trusted; layering in a rank tracker or GEO visibility tool too early just adds more numbers to a dashboard that hasn’t proven itself useful yet.
Tools That Make These Dashboards Easy to Build
| Tool | Best Fit | Starting Price |
|---|---|---|
| ConvoData | Conversational — ask, don’t build | $39/mo |
| Whatagraph | White-label client and cross-channel dashboards | ~$199/mo |
| Google Search Console + GA4 | Free foundation for any layout above | Free |
Frequently Asked Questions
What should an SEO dashboard include at minimum?
Organic traffic trend, keyword ranking movement, click-through rate, top landing pages, and one technical health indicator, all with month-over-month comparison.
What is a GEO dashboard?
A dashboard tracking visibility in AI answer engines like ChatGPT, Perplexity, and Gemini — a newer discipline sometimes called generative engine optimization, alongside traditional search rankings.
Can I build an SEO dashboard for free?
Yes — Google Search Console and GA4 are both free and cover most core SEO metrics; you'll need a visualization tool like Looker Studio to combine them into a single view.
What's the difference between a dashboard and asking ConvoData a question?
A dashboard is a fixed layout built in advance to answer expected questions. ConvoData skips that step — you ask the specific question you have right now and get a live answer plus a recommendation.
How many metrics should an SEO dashboard show at once?
Cap the primary view at 5 to 8 metrics — more than that turns the dashboard into a wall of numbers nobody scans in full, and the one metric that matters most gets lost.
Should rank tracking data come from Search Console or a dedicated rank tracker?
Search Console shows average position based on real impressions, which is a good free starting point; a dedicated rank tracker like Ahrefs or Semrush gives daily position snapshots and competitor comparison Search Console doesn't provide.
How far back should an SEO dashboard show historical data?
Twelve to thirteen months is the standard default, since it lets you compare the current month against the same month a year earlier and account for seasonality. A shorter window makes it easy to mistake a normal seasonal dip for an actual performance problem.
Should a client-facing SEO dashboard show competitor data?
Sparingly, and only when it adds context the client couldn't get elsewhere — a share-of-voice trend against two or three named competitors is useful, but a dashboard cluttered with competitor metrics on every screen tends to distract from the client's own performance rather than support it.
Pick the SEO dashboard example closest to your next report, rebuild it in your tool of choice this week — or connect your data to ConvoData and just ask the question instead. Plans start at $39/month.
If you want to build your own version of one of these rather than adapt a template, our step-by-step guide to building an SEO dashboard combining GA4, GSC, and Ahrefs walks through the process. For the reporting layer specifically, we have also rounded up the best SEO reporting tools for agencies, and our complete guide to SEO analytics covers how to read the numbers once the dashboard is live.