


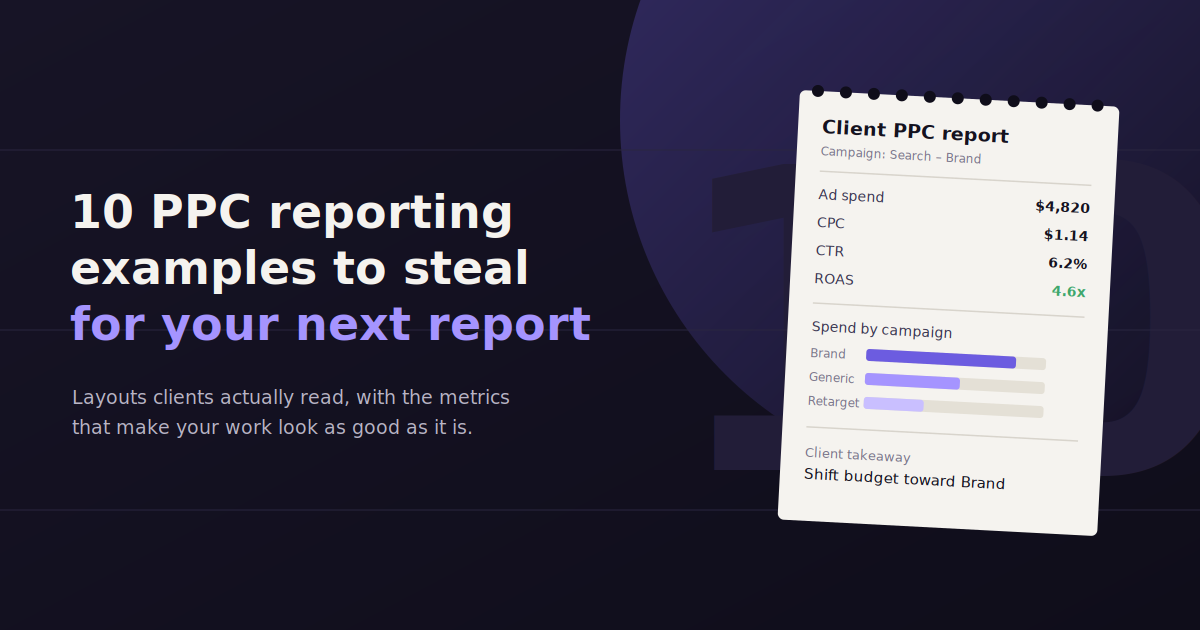
A PPC report that just lists spend and clicks tells a client nothing about whether the campaign is actually working.
These PPC reporting examples show the layouts that connect spend to outcomes — across channels, industries, and campaign types — so a client can see the return, not just the activity.
One example here skips the report format entirely: ConvoData lets you ask a direct question about ad performance and get a live answer plus a recommendation, instead of reading a static deck.
Copy whichever layout matches your next report, then swap in the client’s actual goals and channels.
What Should a PPC Report Include?
A strong PPC report opens with a clear executive summary, shows goal pacing against the monthly budget, leads with top-line KPIs like ROAS and CPA, breaks performance down by campaign, and closes with specific next-step recommendations.
- Executive summary — two or three sentences on how the account performed, in plain language.
- Goal pacing — spend and results tracked against the monthly target, not just a raw total.
- Top-line KPIs — ROAS, CPA, and conversion volume front and center.
- Granular breakdown — performance by campaign or ad group, not just an account-wide blend.
- Actionable next steps — specific changes planned for the next period, tied to what the data showed.
10 PPC Reporting Examples by Use Case
1. The Conversational PPC Report (ConvoData)
Instead of a static report, ConvoData lets you ask “why did ROAS drop last week” and get a live, data-backed answer plus a suggested fix — useful for the follow-up questions a report alone can’t anticipate.
It supports 14 live integrations today out of a 27-integration roadmap and starts at $39/month, making it a low-cost companion to whatever report format you already use.
2. Cross-Channel PPC Report
Blends Google, Meta, LinkedIn, and TikTok Ads into one view with a consistent blended ROAS — the standard format for a monthly account-wide check-in.
3. Google Ads Report for Lead Generation
Centers on cost per lead and lead quality by campaign, since raw click volume rarely matters as much as qualified pipeline for lead-gen accounts.
4. Google Ads + Shopify Ads Report
Pairs ad spend directly against Shopify revenue and ROAS, closing the loop between ad platform metrics and actual store performance.
5. Performance Max Campaign Report
Breaks out asset group performance and channel mix within Performance Max, since the campaign type’s automation can otherwise hide where results are actually coming from.
6. Facebook Ads Report for Lead Generation
Tracks cost per lead by audience and creative, since Meta’s lead-gen performance varies more by creative fatigue than most other objectives.
7. Meta Ads Report for Ecommerce
Leads with ROAS and purchase volume by campaign objective, with a secondary view on creative-level performance to guide the next round of ad testing.
8. LinkedIn Ads Report
Focuses on cost per lead and lead quality by job title or company size targeting, given LinkedIn’s premium CPCs make efficiency reporting especially important.
9. TikTok Ads Report
Centers on view-through rate and cost per acquisition by creative format, since TikTok performance is driven more by creative than by targeting precision.
10. Real Estate / Ecommerce PPC Report
Industry-specific reports swap generic KPIs for what actually matters — cost per qualified lead for real estate, ROAS and average order value for ecommerce.
Why Generic PPC Reports Lose Client Trust
A report that shows the same five metrics regardless of industry or campaign type reads as a template, not an analysis — and clients notice the difference.
Real estate clients care about cost per qualified lead, not raw click volume. Ecommerce clients care about ROAS and average order value, not impressions. Matching the report to what the client actually measures success by builds more trust than any chart design choice.
The other common trust-breaker is a report with no explanation for a bad month. Numbers without context force the client to assume the worst; a short, honest note about what happened and what’s changing next does more for retention than a polished chart ever will.
Matching PPC Metrics to Campaign Goal
A single report that treats an awareness campaign, a consideration campaign, and a conversion campaign the same way will always undersell at least two of the three. The metrics that lead the page should shift with the objective.
Putting CTR at the top of a report for a campaign whose only job is driving purchases buries the number the client actually cares about. Lead with the metric tied to the stated goal, then use the rest of the report to explain why it moved.
| Campaign Goal | Primary Metrics | Secondary Metrics |
| Awareness | Impressions, reach, CPM | View-through rate, brand search lift |
| Consideration | CTR, cost per click, landing page engagement | Time on site, pages per session |
| Lead generation | Cost per lead, lead quality score | Form completion rate, cost per qualified lead |
| Ecommerce / sales | ROAS, cost per acquisition | Average order value, new vs. returning customer split |
How to Present a Bad Month Without Losing the Client
Clients rarely fire an agency over one weak month of PPC performance. They fire an agency that goes quiet or vague when a weak month happens.
- Name the number first. Open with the metric that dropped and by how much — clients spot a buried bad number faster than a buried good one.
- Give the specific cause. “CPCs rose 18% after a competitor entered the auction” is credible. “Market conditions” is not.
- Separate what you controlled from what you didn’t. A platform-wide auction shift is different from a paused campaign nobody caught — say which one happened.
- Show the fix already in motion. State the exact change made this week, not a vague plan for “next month.”
- Compare against the right baseline. A dip that still beats the same month last year reads very differently than a dip framed against last month alone — use whichever comparison is honest, and say which one you’re using.
Weekly vs. Monthly PPC Reporting: Which Cadence Fits
Monthly reporting is the default for most retainers because it gives enough data volume for trends to be meaningful rather than noise — a week of ecommerce PPC data can swing 20% on order volume alone with no underlying performance change.
Weekly reporting fits new accounts still in the learning phase, high-spend accounts where a bad week has real budget consequences, and any campaign in active testing where the team needs fast feedback to iterate.
The two aren’t mutually exclusive. A common pattern is a lightweight weekly check-in — three or four numbers, no narrative — paired with a full monthly report that has the executive summary, breakdowns, and next steps. A live tool like ConvoData can cover the gap between the two: instead of a mid-month status email, the client or account manager just asks a direct question and gets a current answer without waiting for the next report cycle.
Building Your Own PPC Report: A Quick Checklist
Before sending any PPC report, confirm the date range matches the client’s billing cycle, spend figures reconcile against the ad platform’s own billing summary, every chart covers the same comparison period, and at least one specific next step is included.
- Confirm the reporting period matches the client’s billing cycle, not a generic rolling 30 days.
- Reconcile total spend against the ad platform’s billing summary before sending.
- Make sure every chart in the report covers the same date range for fair comparison.
- Include at least one specific, named next step — not just “continue optimizing.”
What to Automate in PPC Reporting — and What to Keep Manual
Automation saves the most time on the parts of a PPC report that are purely mechanical. It costs the most trust on the parts that require judgment.
- Automate: pulling spend, clicks, and conversions from each ad platform into one place — doing this by hand invites transcription errors and eats hours every reporting cycle.
- Automate: chart generation and period-over-period comparisons once the data is centralized — these are formulaic and don’t benefit from a human doing them manually.
- Keep manual: the executive summary. A templated one-liner like “performance was stable” reads as generic even when it’s accurate, and clients can tell the difference between a summary that references their actual account and one that doesn’t.
- Keep manual: the next-step recommendations. This is the part clients are paying an agency for — automating it away removes the reason to have an agency at all.
- A tool like ConvoData sits in between: the data pull and the first-pass analysis are automated, but the account manager still reviews the answer and decides what to tell the client, rather than sending a raw export.
Step-by-Step: Building a PPC Report From Scratch
- Confirm the goal before pulling any data. A report built around ROAS for a lead-gen account, or cost per lead for an ecommerce account, is wrong before it’s even opened — check the client’s actual objective first.
- Pull raw numbers from each ad platform. Export or connect Google Ads, Meta, LinkedIn, and any other active channel for the exact same date range.
- Reconcile spend against platform billing. A report showing different total spend than the client’s invoice creates an immediate credibility problem, so check this before anything else.
- Build the account-wide summary first, then drill into campaigns. Starting at the top gives the reader context before the detail, rather than dumping campaign-level tables with no framing.
- Write the executive summary last. It’s easier to summarize accurately once every number has already been reviewed than to write it first and hope the data backs it up.
- Add exactly one next step per key finding. A report that ends with a long list of possible actions reads as indecisive — pick the highest-impact change and commit to it.
Tools That Make These Reports Easy to Build
| Tool | Best Fit | Starting Price |
| ConvoData | Conversational — ask instead of building a report | $39/mo |
| Whatagraph | Cross-channel PPC report templates | ~$199/mo |
| Looker Studio | Free, fully custom report layouts | Free |
Frequently Asked Questions
What should a PPC report include at minimum?
An executive summary, goal pacing against budget, top-line KPIs like ROAS and CPA, a campaign-level breakdown, and specific next-step recommendations.
How often should PPC reports be sent to clients?
Monthly is standard for most retainers, with live dashboard or conversational access available for clients who want more frequent check-ins between formal reports.
What's the cheapest way to build a free PPC report?
Looker Studio is free and connects natively to Google Ads, though non-Google platforms need a paid connector and building a polished template takes real setup time.
How is ConvoData different from a PPC report template?
A template is a fixed layout you fill in each period. ConvoData skips that — you ask a live question about performance and get an answer pulled directly from your connected ad accounts, plus a recommendation.
What's a good ROAS to show in a PPC report?
It depends entirely on the client's margin, so a report should show the account's own target ROAS next to the actual figure rather than an industry benchmark. A 3:1 ROAS is strong for a low-margin retailer and weak for a high-margin service business — the client's break-even point is the only number that matters.
Should a PPC report include impressions and clicks, or just conversions?
Include both, but don't give them equal weight. Impressions and clicks explain why conversions moved — a CPA spike is a different problem if it's caused by falling CTR versus falling conversion rate on the landing page — so keep them as supporting context under the conversion metrics, not as headline numbers.
How long should a client-facing PPC report be?
One to two pages for a monthly summary is standard. Anything longer usually means raw data is being pasted in instead of interpreted — a good report answers 'how did we do and what's next,' and most of that fits on two pages with the rest available as an appendix or a live dashboard link.
Pick the PPC report example closest to your next client update, rebuild it this week — or connect your ad accounts to ConvoData and ask it why last week’s numbers moved. Plans start at $39/month.
If you are building these reports manually rather than automating the pull, our roundup of the best PPC reporting tools for agencies covers where that time actually goes. Whatever layout you land on, benchmark the numbers you are reporting against realistic targets using our guide to PPC benchmarks, and make sure the KPIs leading the report are the ones that actually belong there — see our breakdown of KPIs for advertising.