


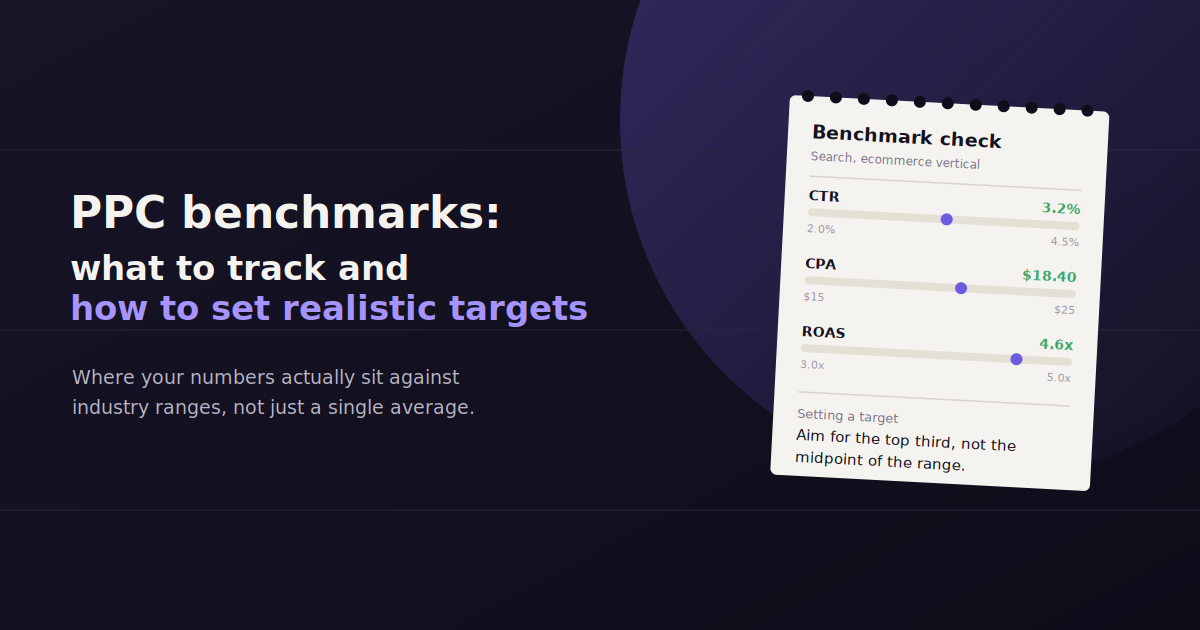
A PPC benchmark is a reference point — usually an industry average — that tells you whether your CTR, CPC, CPA, or ROAS is landing in a normal range for accounts like yours.
Benchmarks are useful for a gut-check, but they’re a starting point, not a scorecard. Two accounts in the same industry can have very different benchmarks based on funnel length, average order value, and how competitive their specific keywords are.
This guide covers the core PPC metrics worth benchmarking, why industry averages vary so much, how to build your own internal benchmarks from account history, and how to report performance against benchmarks without letting a stale external number set unrealistic expectations.
A tool like ConvoData helps by pulling your account’s own historical performance directly from your connected Google Ads and Meta Ads accounts, so internal benchmarks are based on your real trend line, not a guess.
What Are PPC Benchmarks?
PPC benchmarks are reference metrics — typically industry or account averages for CTR, CPC, CPA, conversion rate, and ROAS — used to judge whether a campaign’s performance is in a normal, healthy range for its category.
Benchmarks answer a simple but important question: is this number good, bad, or normal? Without a reference point, a 2% CTR or a $40 CPA is just a number with no context attached.
There are two kinds of benchmarks worth distinguishing. External benchmarks come from published industry reports and show how a typical account in your vertical performs. Internal benchmarks come from your own account’s history and show how your specific account has performed over time.
Both have a role. External benchmarks help during onboarding, when you have no account history yet. Internal benchmarks become more reliable and more useful the longer an account runs.
Core PPC Metrics to Benchmark
The core metrics worth benchmarking in any PPC account are CTR, CPC, CPA, conversion rate, Quality Score, and ROAS — together they show whether ads are relevant, efficiently priced, and actually converting into revenue.
Each of these metrics tells you something different about where a campaign might be underperforming, and benchmarking all of them together paints a fuller picture than any single number alone.
Click-Through Rate (CTR)
CTR measures how often people who see your ad click it. It’s the first signal of whether your ad copy and targeting are relevant to the audience seeing them — a low CTR against a reasonable benchmark usually points to weak creative, mismatched keywords, or the wrong audience.
Cost Per Click (CPC)
CPC reflects both keyword competitiveness and your Quality Score — accounts with tighter, more relevant ad-to-keyword matches often pay less per click than competitors bidding on the same terms with weaker relevance.
Cost Per Acquisition (CPA)
CPA measures what it costs to generate one conversion. It’s one of the most directly actionable PPC metrics, since it ties spend to an actual business outcome rather than just clicks or impressions.
Conversion Rate
Conversion rate shows what percentage of clicks turn into the action you care about — a purchase, lead form, or signup. A CTR that looks strong but a conversion rate that lags usually points to a landing page or offer problem, not a targeting problem.
Quality Score
Quality Score (Google Ads’ 1–10 rating of ad relevance, expected CTR, and landing page experience) directly affects both your CPC and your ad rank. A low Quality Score is often the root cause behind a high CPC, not a separate issue.
Return on Ad Spend (ROAS)
ROAS measures revenue generated per dollar of ad spend, and it’s the metric that ultimately determines whether a campaign is actually profitable — a campaign can hit every other benchmark and still lose money if ROAS doesn’t clear the account’s break-even threshold.
Why Benchmarks Vary So Much by Industry
PPC benchmarks vary heavily by industry because of differences in competition, average order value, purchase intent, and sales-cycle length — a legal services CPC and an ecommerce CPC live in entirely different ranges for structural reasons, not performance quality.
Comparing your account’s CPC to a completely different industry’s average is one of the most common benchmarking mistakes, and it’s worth understanding why the gap exists before you make that comparison.
High-value, high-competition categories like legal services or insurance tend to have much higher CPCs, because each conversion is worth far more to the advertiser, which drives up what businesses are willing to bid. Lower-consideration ecommerce categories often see much lower CPCs but need higher volume to hit the same revenue target.
Purchase intent also varies by industry and by keyword type within an industry — a bottom-funnel, high-intent search term will consistently outperform a broad, top-funnel term on both CTR and conversion rate, regardless of industry.
Because these figures shift over time and vary by data source, don’t rely on a single stale number from an old article. Check current-year industry benchmark reports from sources like Google, Semrush, or WordStream for a range that reflects present market conditions, and treat even that range as a starting point rather than a target to hit exactly.
How to Set Realistic Internal Benchmarks From Your Own Account History
Build internal PPC benchmarks by tracking your own account’s rolling average for CTR, CPA, and ROAS over several months, adjusting for seasonality, and using that trend line as your true baseline instead of relying solely on external industry averages.
External benchmarks tell you how a typical account performs. Internal benchmarks tell you how your account performs, which is almost always the more actionable number once you have enough history to calculate one.
Start by pulling at least three to six months of performance data for your core metrics. Calculate a rolling average rather than relying on a single best or worst month, since individual months can be skewed by a promotion, a seasonal spike, or a tracking issue.
Segment benchmarks by campaign type and funnel stage rather than blending everything into one account-wide average. A prospecting campaign and a retargeting campaign should never share the same CPA benchmark — they’re solving different problems at different points in the funnel.
Revisit internal benchmarks on a regular cadence, not just once. An account’s baseline shifts as competition changes, as creative fatigues, and as the market itself moves — a benchmark set a year ago may no longer reflect a realistic target today.
Pull three to six months of historical data per metric before calculating a baseline.
Segment by campaign type, funnel stage, and device where the data supports it.
Flag and exclude anomalous periods (major promotions, tracking outages) before averaging.
Revisit the baseline quarterly, or sooner after a major account or market change.
How to Report PPC Performance Against Benchmarks to Clients
Report PPC performance against both external industry benchmarks and the account’s own historical baseline, framing results as a trend against a self-set target rather than a pass/fail comparison to an external number that may not reflect the account’s specific context.
The clearest client reports show two comparisons side by side: how the account is performing against a broad industry benchmark, and how it’s performing against its own historical baseline. The second comparison usually matters more.
Explain the “why” behind a number that misses benchmark, not just the gap itself. A CPA that’s above the industry average but trending down month over month tells a very different story than one that’s above average and flat.
This is where a conversational reporting tool changes the workflow. Instead of manually calculating a rolling average and pulling last quarter’s numbers for comparison every time a client asks how a campaign compares to its usual performance, a tool like ConvoData can answer directly from your connected Google Ads or Meta Ads data — “how does this month’s CPA compare to our six-month average” — and suggest what to look at next if the answer isn’t good news.
Where to Find Current PPC Benchmark Data
Reliable current-year PPC benchmark data comes from sources that regularly refresh their reports using live advertiser data, such as Google’s own platform resources, Semrush, and WordStream — always check the report’s publish date before using its figures.
Not all benchmark sources are equally current or equally rigorous, and using a stale report is one of the fastest ways to set an unrealistic internal target.
Semrush and WordStream both publish PPC benchmark reports that break figures out by industry and update them periodically using aggregated advertiser data. Google’s own platform resources and help center content also surface general guidance on what drives performance, though they’re less focused on precise numeric benchmarks by vertical.
Whichever source you use, check the publish date first. A benchmark report is only useful if it reflects the current competitive and economic environment — a number from several years ago can be actively misleading given how much auction dynamics shift year to year.
Common PPC Benchmarking Mistakes
A handful of avoidable mistakes account for most of the misleading benchmark comparisons that show up in client reports.
Comparing against an irrelevant industry. Benchmarks from a completely different vertical, business model, or average order value aren’t a fair comparison, even if the channel is the same.
Ignoring seasonality. Comparing a holiday-season month to a slow-season benchmark (or vice versa) will make performance look artificially good or bad.
Chasing CTR instead of ROAS. A high CTR with poor conversion quality can look like success on one metric while quietly losing money on the metric that actually matters.
Using a benchmark that’s several years stale. Auction dynamics, average CPCs, and platform algorithms shift constantly — a benchmark report from three years ago may no longer describe today’s market.
Treating benchmarks as a hard target rather than a range. Real accounts have month-to-month variance; expecting every metric to land exactly on benchmark every month sets an unrealistic bar.
Benchmarks only mean something once you are confident you are tracking the right underlying metrics — our guide to AdWords metrics explained covers how each one is calculated. For help deciding which of these numbers deserve KPI status versus which are just useful context, see our piece on KPIs for advertising, and if you want inspiration for how to present benchmark comparisons to clients, these PPC reporting examples are worth a look.
Frequently Asked Questions
What is considered a good CTR for PPC ads?
It varies significantly by industry, platform, and campaign type — search ads with high purchase intent typically see higher CTRs than display or social. Check a current-year benchmark report for your specific industry rather than relying on a single universal number, and compare against your own account's history for the most reliable read.
How often do PPC benchmarks change?
Industry benchmark reports are typically updated annually, but auction dynamics, competition, and seasonal demand can shift meaningfully within a single year — always confirm you're looking at a current-year report.
Should I benchmark against competitors or my own account history?
Both, but weight your own account history more heavily once you have enough data. External benchmarks are most useful early on or when entering a new market; internal benchmarks reflect your specific audience, offer, and funnel more accurately.
What's the difference between CPA and ROAS as benchmarks?
CPA benchmarks what it costs to get one conversion; ROAS benchmarks how much revenue that spend generates. A campaign can meet its CPA benchmark and still be unprofitable if the resulting revenue per conversion is too low, which is why ROAS is often the more decisive metric.
How many months of data do I need to set a reliable internal benchmark?
Three to six months is a reasonable minimum for most accounts, enough to smooth out single-month anomalies while still reflecting recent performance rather than outdated trends.
Do PPC benchmarks differ between Google Ads and Meta Ads?
Yes — the platforms have different audience intent levels, ad formats, and auction dynamics, so a CTR or CPC benchmark on one platform shouldn't be applied directly to the other, even for the same industry.
Stop guessing whether this month’s numbers are actually normal for your account. Connect your ad accounts to ConvoData, ask it how current performance compares to your own historical benchmark, and get an answer with a suggested next step — plans start at $39/month.