


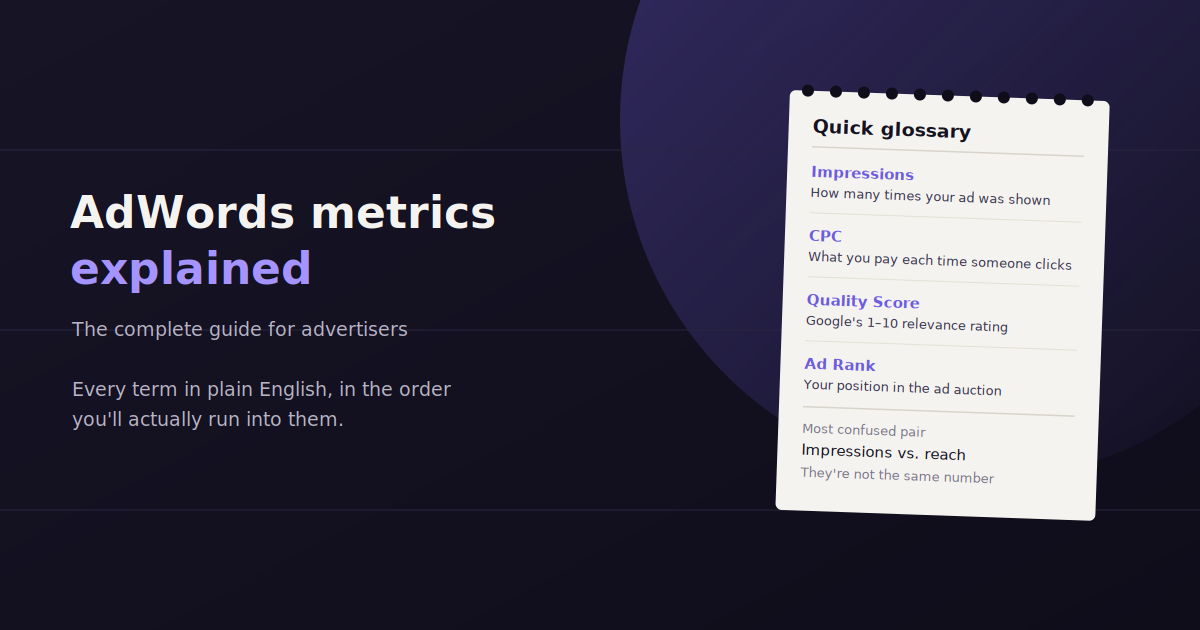
Google Ads’ reporting interface surfaces dozens of columns, and it’s easy to end up staring at a spreadsheet full of numbers without a clear sense of which ones actually matter.
AdWords metrics (the term most advertisers still use, even though the platform is officially Google Ads) break down into a handful of categories: reach, engagement, conversion, and cost efficiency.
Tracking the wrong ones — or tracking all of them with equal weight — is a common way accounts drift without anyone noticing until budget has already been wasted.
This guide walks through the metrics that matter most, how each one is calculated, and how to build a reporting habit around them that actually informs decisions.
Why AdWords Metrics Matter Beyond a Reporting Checkbox
Every metric in Google Ads answers a different question: is the ad being seen, is it being clicked, is the click turning into a result, and is that result worth what it cost.
Treating them as one undifferentiated pile of numbers is how accounts end up optimizing for the wrong thing — chasing a high click-through rate on ads that never actually convert, for example.
The metrics below are grouped by what stage of the funnel they measure, which makes it easier to diagnose exactly where a campaign is underperforming.
Core AdWords Metrics at a Glance
The core AdWords metrics are impressions, CTR, average CPC, conversion rate, cost per conversion (CPA), and ROAS — together they trace the full path from an ad being shown to it generating measurable revenue.
| Metric | Formula | What It Tells You |
|---|---|---|
| CTR | Clicks ÷ Impressions | How compelling the ad is to people who see it |
| Avg. CPC | Total Cost ÷ Clicks | What you’re paying per click on average |
| Conversion Rate | Conversions ÷ Clicks | How well the landing experience turns clicks into results |
| CPA | Total Cost ÷ Conversions | What each result actually costs you |
| ROAS | Revenue ÷ Ad Spend | Whether the spend is generating profitable return |
| Quality Score | 1–10 scale from Google | Relevance of ad, keyword, and landing page together |
Impression and Click Metrics
These metrics sit at the top of the funnel — they measure whether an ad is being shown and whether people are engaging with it at all.
Impressions
Impressions count how many times an ad was shown, regardless of whether anyone clicked. On their own, they say little about performance — but a sudden drop can flag a budget cap, a disapproved ad, or bid competitiveness issues.
Impression trends are most useful compared against impression share, which shows what percentage of eligible auctions the ad actually appeared in.
Click-Through Rate (CTR)
CTR measures how compelling an ad is relative to how often it’s shown. A low CTR usually points to weak ad copy, poor targeting, or a mismatch between the keyword and the ad message.
CTR also directly feeds Quality Score, which means a chronically low CTR can quietly raise costs across an entire campaign, not just on the underperforming ad.
Average CPC
Average cost-per-click reflects both bid strategy and competition in the auction. A rising average CPC over time, with flat performance elsewhere, often signals increasing competition rather than a targeting problem.
It’s most useful watched alongside conversion rate — a higher CPC is fine if conversion rate is rising fast enough to keep CPA in check.
Conversion and Efficiency Metrics
Conversion rate, cost per conversion, and ROAS are the metrics that actually connect ad spend to business results — clicks and impressions describe visibility, but these three describe whether the campaign is profitable.
These are the metrics that matter most to whoever is signing off on the budget, because they translate ad activity into business outcomes.
Conversion Rate
Conversion rate measures how many clicks actually turn into the action you’re tracking — a purchase, a lead form, a signup. A strong CTR paired with a weak conversion rate usually points to a landing page or offer problem, not an ad problem.
This is one of the clearest diagnostic metrics in the account: it isolates whether the issue is getting people to click, or getting them to act once they arrive.
Cost Per Acquisition (CPA)
CPA tells you what each conversion actually costs. It’s the metric most budget conversations come back to, since it’s the most direct link between spend and result.
A rising CPA with stable conversion volume usually means increasing competition or auction pressure; a rising CPA with dropping volume often points to a targeting or bid strategy issue.
Return on Ad Spend (ROAS)
ROAS compares revenue generated against what was spent to generate it, making it the clearest profitability signal available directly inside the platform.
It requires accurate revenue tracking to mean anything — a broken or incomplete conversion value setup will make ROAS numbers misleading regardless of actual campaign performance.
Quality and Relevance Metrics
These metrics don’t directly measure results, but they influence cost and eligibility for every other metric on this list.
Quality Score combines expected CTR, ad relevance, and landing page experience into a 1-10 score. A higher score generally means lower costs and better ad positions for the same bid.
Impression Share shows what percentage of available auctions your ads actually appeared in. A low impression share due to budget means real demand is going unserved; a low impression share due to rank means the ad or bid needs work.
Search Impression Share — the percentage of eligible search auctions your ad appeared in.
Search Lost IS (Budget) — impression share lost specifically because of budget constraints, a clear signal that a campaign is capped, not underperforming.
Search Lost IS (Rank) — impression share lost due to ad rank, pointing to a bid or Quality Score issue rather than a budget one.
Budget and Pacing Metrics
Budget metrics matter most for catching problems early, before a month closes and the spend is already gone.
Tracking daily and weekly spend pace against the monthly budget target lets you catch overspend or underspend while there’s still time to adjust bids or budgets.
This is also where Search Lost IS (Budget) becomes actionable — if it’s climbing, the campaign has more available demand than budget allotted to capture it.
Building a Google Ads Metrics Dashboard That People Actually Use
The most common dashboard mistake is including every available metric because it’s technically possible to pull. That produces a report nobody reads closely enough to act on.
A better approach groups metrics by the question they answer — reach, engagement, conversion, cost — and shows only the two or three that matter most for each, alongside a trend line rather than a single snapshot.
Some teams are shifting away from static dashboards entirely for this kind of diagnostic work. ConvoData, for example, lets you ask directly — “why did CPA rise in this campaign last week” — and get a live answer pulled from the connected Google Ads data, plus a suggested next step, instead of hunting through columns yourself to figure out which metric moved and why.
Common Mistakes When Interpreting AdWords Metrics
The most frequent mistake is optimizing for a top-of-funnel metric like CTR in isolation, without checking whether that traffic is actually converting downstream.
A close second is comparing metrics across campaigns with fundamentally different goals — a brand awareness campaign and a bottom-funnel conversion campaign shouldn’t be judged on the same CPA benchmark.
The third is reacting to single-day fluctuations. Google Ads data is noisy day to day; a metric needs at least a week of data, often more, before a swing means anything actionable.
Chasing CTR alone without checking conversion rate downstream.
Comparing dissimilar campaigns on the same benchmark regardless of funnel stage or goal.
Reacting to daily noise instead of waiting for a statistically meaningful trend.
Ignoring Quality Score until costs are already elevated across the account.
AdWords Metrics by Campaign Type
The metrics that matter most shift depending on what kind of campaign you’re running, and applying the wrong lens is a common source of confusion when comparing performance across an account.
A Search campaign built for direct response should be judged primarily on conversion rate and CPA. A Display or video campaign built for awareness should be judged more on reach and view rate, with conversion metrics treated as a secondary signal rather than the headline number.
Search Campaigns
Search campaigns typically show the clearest intent, since the user is actively searching for something related to the ad. CTR, conversion rate, and CPA are the most meaningful metrics here.
Quality Score also matters more on Search than almost anywhere else, since it directly affects both cost and ad position in a competitive auction.
Display and Video Campaigns
Display and video campaigns generally serve earlier in the funnel, so judging them purely on conversion metrics often understates their actual value.
View rate, viewability, and reach tend to be more informative here, with conversion metrics tracked as a secondary, longer-horizon signal rather than a same-week decision point.
Shopping and Performance Max Campaigns
Shopping and Performance Max campaigns lean heavily on ROAS, since they’re typically tied directly to product revenue rather than a single lead-generation goal.
Because Performance Max automates targeting across multiple placements, segment-level metrics are less visible than in a standard Search campaign, which makes revenue-based metrics like ROAS a more reliable read on performance than click-level data alone.
How Often to Review AdWords Metrics
Budget pacing and disapproval checks deserve a quick daily glance, especially on high-spend accounts where a misconfiguration can burn through budget fast.
CTR, conversion rate, and CPA are better reviewed weekly, giving enough data to smooth out daily noise while still catching problems early.
ROAS and broader strategic decisions — pausing a campaign, shifting budget between channels — are best made on a monthly view, once there’s enough conversion volume to trust the trend.
Once you are tracking the right AdWords metrics, benchmarking them against realistic targets is the natural next step — see our guide to PPC benchmarks and how to set them. If you are deciding which of these numbers to prioritize as a KPI rather than just a data point, our breakdown of KPIs for advertising covers that distinction, and for turning the reporting itself into less manual work, see our roundup of the best PPC reporting tools for agencies.
Frequently Asked Questions
What is the most important AdWords metric to track?
There isn't a single universal answer — it depends on the campaign goal. For most advertisers, cost per acquisition (CPA) or ROAS matters most since they connect spend directly to business results, while CTR and Quality Score matter more for diagnosing why performance is off.
What is a good CTR for Google Ads?
It varies significantly by industry and campaign type, and Search campaigns typically see meaningfully higher CTR than Display. Rather than chasing a universal benchmark, compare CTR against your own account's historical average for the same campaign type.
What's the difference between CPA and ROAS?
CPA measures cost per individual conversion, useful when conversions have similar value. ROAS measures revenue generated relative to spend, which is more useful when conversion values vary significantly, like in ecommerce.
Why does Quality Score matter if it's not a direct performance metric?
Quality Score influences both cost per click and ad position for the same bid. A low score means paying more for worse placement, which indirectly raises CPA and lowers ROAS even though it isn't a conversion metric itself.
How often should AdWords metrics be reviewed?
Budget pacing benefits from a daily glance on high-spend accounts. CTR, conversion rate, and CPA are best reviewed weekly. ROAS and bigger strategic decisions are usually best made on a monthly basis once there's enough data volume.
What does Search Lost Impression Share (Budget) mean?
It shows the percentage of eligible auctions your ad missed specifically because the campaign ran out of budget, not because of a low ad rank — a clear signal that available demand exceeds what's currently funded.
Can Google Ads metrics be automated into a dashboard?
Yes — most advertisers connect Google Ads to a reporting or connector tool to automate the data pull. Some now use conversational tools that go a step further and answer specific performance questions directly, rather than requiring the data to be manually interpreted.
Do Display and Video campaigns need different metrics than Search?
Yes — Display and video campaigns generally serve earlier in the funnel and are better judged on reach, view rate, and viewability, while Search campaigns are better judged on CTR, conversion rate, and CPA since intent is typically higher.
Why does ROAS matter more for Shopping and Performance Max campaigns?
These campaign types are typically tied directly to product revenue and automate targeting across multiple placements, which limits visibility into segment-level click data. Revenue-based ROAS becomes a more reliable performance signal than click metrics alone.
Stop scrolling through columns to figure out which metric actually needs attention. Connect your Google Ads account to ConvoData and ask it directly — plans start at $39/month.