


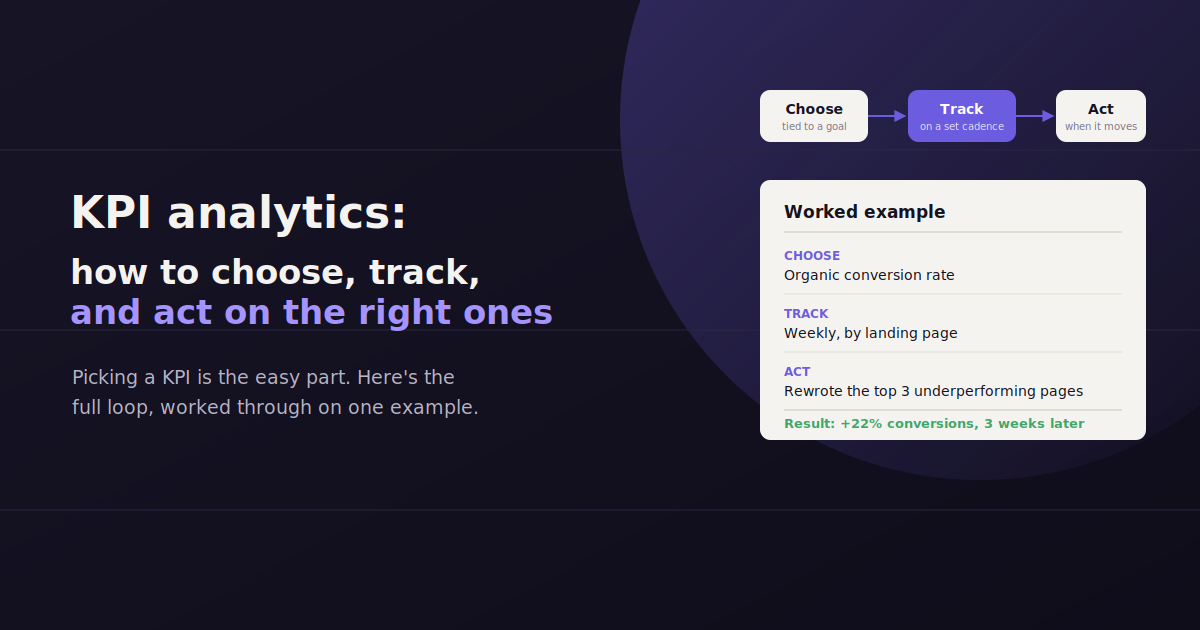
KPI analytics is the practice of tracking key performance indicators against a goal, then using that ongoing data to decide what’s working, what isn’t, and what to change next.
The word “analytics” is doing real work in that definition. Picking a KPI is easy; building the habit of actually analyzing it — comparing it to a target, a prior period, and a benchmark — is where most teams fall short.
This guide covers what KPI analytics actually involves, how to choose KPIs that reflect real business outcomes instead of vanity numbers, the frameworks worth knowing, and a practical approach to tracking them without drowning in dashboards.
What Is KPI Analytics?
KPI analytics is the ongoing process of measuring key performance indicators against targets and trends, not just reporting the numbers — turning a static metric into an input for a decision about what to do next.
A key performance indicator (KPI) is a specific, measurable value tied to a business goal — cost per lead, conversion rate, customer retention rate. KPI analytics is what happens after you start collecting that number: comparing it to a target, watching how it trends, and figuring out why it moved.
The distinction matters because a lot of teams stop at the first half. They track cost per lead every month, watch it go up and down, and never build the habit of asking why — which is where the actual value of tracking it in the first place gets lost.
Good KPI analytics closes that loop. A number moves, someone asks why, and that answer changes what the team does next month. Without that last step, a KPI dashboard is just a more organized way of ignoring your own data.
Why KPI Analytics Matters
Businesses generate far more data than any team can reasonably act on. KPI analytics is the filter that turns that raw volume into a short list of numbers worth paying attention to.
It also creates a shared language across a team. When everyone agrees that cost per acquisition is the number that matters most this quarter, decisions get faster because there’s less debate about which metric should win an argument.
Finally, it gives you an early warning system. A KPI that’s been tracked consistently for months will show a problem — a dip in conversion rate, a spike in churn — well before it shows up in quarterly revenue.
How to Choose the Right KPIs
Choosing the right KPIs starts with the specific business goal a team is trying to move, then narrowing to a small number of metrics that are measurable, tied to that goal, and realistic to influence — rather than tracking every number a platform happens to report.
The single biggest KPI mistake is choosing metrics because they’re easy to measure rather than because they matter. Impressions are effortless to track and mean almost nothing on their own; a well-defined conversion rate takes more setup and tells you far more.
Start from the goal, not the data source. If the goal is “grow qualified pipeline,” the KPI is something like marketing-qualified leads or lead-to-opportunity rate — not page views, which only loosely connects to that goal.
A useful gut check: if this number went up 20% next month, would anyone on the team change what they’re doing? If the honest answer is no, it’s probably not a KPI — it’s just a metric.
Tie it to a specific goal — every KPI should trace back to a business outcome someone in the room actually cares about.
Keep the list short — three to seven KPIs per team is a reasonable range; beyond that, nothing gets prioritized.
Make sure someone can influence it — a KPI the team has no real ability to move creates frustration, not focus.
Separate leading and lagging indicators — track at least one number that predicts a result (like pipeline created) alongside the lagging outcome it eventually produces (like closed revenue).
The SMART Framework for KPIs
SMART is the most common framework for evaluating whether a KPI is well-defined: Specific, Measurable, Achievable, Relevant, and Time-bound — a quick filter for catching vague or unrealistic metrics before a team commits to tracking them.
SMART is the framework most teams reach for first, and it holds up well as a sanity check even if you don’t formally run through every letter for every KPI.
Specific — “increase website traffic” is a wish. “Increase organic sessions from blog content by 15%” is a KPI.
Measurable — the KPI needs a clean, reliable data source. If getting the number requires three manual steps and a judgment call, it will drift out of date fast.
Achievable — a target should stretch the team without being disconnected from what’s realistically possible given current resources.
Relevant — the KPI should connect to a goal that actually matters to the business right now, not a goal from two strategies ago that nobody revisited.
Time-bound — every KPI needs a window: this month, this quarter, this fiscal year. A number with no deadline never creates urgency.
Other KPI Frameworks Worth Knowing
OKRs (Objectives and Key Results)
OKRs pair a qualitative objective (“become the trusted authority in our category”) with a small set of quantitative key results that prove progress toward it. KPIs often serve as the key results inside an OKR structure.
The distinction that matters: an objective is aspirational and doesn’t need to be fully achievable, while the key results underneath it should be concrete and measurable.
The Balanced Scorecard
This framework spreads KPIs across four categories — financial, customer, internal process, and learning/growth — so a team doesn’t over-index on revenue numbers while ignoring the operational metrics that produce them.
It’s most useful for organizations that have historically tracked only financial KPIs and want a more complete picture of business health.
Leading vs. Lagging Indicators
This isn’t a full framework so much as a lens, but it’s one of the most practically useful ones. Lagging indicators (revenue, churn) tell you what already happened. Leading indicators (demo requests, trial signups) tell you what’s likely to happen next.
A KPI set built entirely from lagging indicators leaves a team reacting to results it can no longer influence. Pairing at least one leading indicator with each lagging one gives a team room to course-correct earlier.
How to Track KPIs Effectively
Effective KPI tracking means connecting live data sources instead of manual exports, reviewing numbers on a consistent cadence, comparing against both a target and a prior period, and assigning clear ownership so a moving KPI always has someone accountable for it.
Choosing the right KPIs is half the work. The other half is building a tracking process that survives beyond the first excited week of a new dashboard.
A KPI that’s reviewed once and then forgotten provides almost no value over a KPI that was never tracked at all — the tracking has to become a habit, not a one-time setup task.
Automate the data pull. Manual spreadsheet updates are the most common reason KPI tracking quietly dies a few weeks after launch.
Set a review cadence and stick to it. Weekly for fast-moving metrics like ad spend, monthly for slower ones like retention.
Always compare against something. A KPI shown with no target and no prior period next to it is just a number — context is what makes it a signal.
Assign an owner to every KPI. A metric nobody is responsible for is a metric nobody explains when it drops.
Revisit the list quarterly. Business priorities shift, and a KPI that mattered two quarters ago can quietly stop being the right thing to track.
Common KPI Analytics Mistakes
Tracking vanity metrics. Followers, impressions, and page views are easy to report and rarely tell you whether the business is actually healthier this month.
Too many KPIs. Once a team is tracking twenty numbers, none of them functions as a real priority anymore.
No baseline or target. A KPI trend line means little without knowing what “good” looks like for that specific number.
Changing definitions mid-stream. If “conversion rate” is calculated differently in March than it was in January, the trend line becomes meaningless.
Reporting without analyzing. Sending a monthly KPI summary nobody discusses is reporting, not analytics — the value comes from the conversation the numbers should trigger.
KPI Analytics by Business Function
The right KPIs differ sharply by department: marketing tracks acquisition and engagement metrics, sales tracks pipeline and win rate, customer success tracks retention and satisfaction, and finance tracks efficiency ratios like customer acquisition cost against lifetime value.
Marketing
Marketing KPIs usually cluster around acquisition and engagement: website traffic by channel, cost per lead, marketing-qualified leads, and conversion rate on key landing pages.
The common trap here is over-indexing on top-of-funnel metrics like traffic and impressions while under-tracking what happens after someone actually converts.
Sales
Sales KPIs tend to focus on pipeline health and velocity: number of qualified opportunities, average deal size, win rate, and sales cycle length.
These KPIs work best when reviewed alongside marketing’s lead-generation numbers, since a sales team drowning in low-quality leads will show a declining win rate that has nothing to do with sales performance itself.
Customer Success
Retention rate, churn rate, net promoter score, and customer lifetime value are the standard set here, since the function exists specifically to keep the customers marketing and sales already won.
A commonly missed leading indicator is product usage frequency — customers who stop logging in regularly tend to churn well before that shows up in a retention KPI.
Finance
Finance KPIs often express efficiency as a ratio rather than a raw number: customer acquisition cost against customer lifetime value, gross margin, and burn rate for growth-stage companies.
These KPIs matter to marketing and sales too, since a growing top line built on an unsustainable acquisition cost isn’t actually a healthy trend, even if every marketing KPI looks great in isolation.
Tools Commonly Used for KPI Analytics
Most teams end up combining a few tools rather than relying on one platform for every KPI, since the right data source varies by department.
Google Analytics remains the default for web and marketing KPIs, while CRMs like HubSpot cover sales and pipeline metrics natively.
For teams that need to combine KPIs from multiple sources into one recurring view, dedicated reporting platforms like Databox or Klipfolio handle the aggregation, though they still require someone to build and maintain the underlying dashboard template.
Where Conversational Tools Fit Into KPI Analytics
Most KPI analytics work happens in two separate steps: someone builds a dashboard to display the numbers, and then someone else has to actually interpret why a number moved and what to do about it. The second step is usually the slower one.
Conversational tools like ConvoData collapse those steps. Instead of opening a dashboard and hunting for the KPI that changed, you ask directly — “why did our cost per lead go up this month” — and get a live answer pulled from your connected data sources, along with a suggested next step rather than just the raw number.
This matters most for teams without a dedicated analyst on staff, where the gap between “a KPI moved” and “someone understood why” can otherwise stretch for days.
ConvoData connects to 14 data sources today, out of a 27-integration roadmap that’s expanding regularly, and starts at $39/month — a lighter lift than adopting a full dashboard-building platform just to get faster answers on the KPIs you’re already tracking.
KPI analytics only works as well as the data behind it — see our guide to data-driven marketing for the broader practice this fits into, and our piece on building a marketing data warehouse for where that underlying data should be centralized.
Frequently Asked Questions
What is the difference between a KPI and a metric?
Every KPI is a metric, but not every metric is a KPI. A metric is any measurable number; a KPI is a metric specifically chosen because it's tied to a defined business goal and reviewed regularly to guide decisions.
How many KPIs should a team track?
Most teams do best with three to seven KPIs at a time. Beyond that range, nothing gets treated as a real priority, and review meetings tend to skim past most of the numbers on the list.
What is the SMART framework for KPIs?
SMART stands for Specific, Measurable, Achievable, Relevant, and Time-bound. It's a checklist for evaluating whether a proposed KPI is well-defined enough to actually track and act on, rather than a vague aspiration.
What's the difference between a leading and a lagging KPI?
A lagging KPI (like revenue or churn) reports what already happened. A leading KPI (like trial signups or pipeline created) predicts what's likely to happen next, giving a team time to react before the lagging number confirms it.
How often should KPIs be reviewed?
It depends on how fast the underlying metric moves. Fast-changing numbers like daily ad spend often get a weekly check-in, while slower metrics like customer retention are usually reviewed monthly or quarterly.
Can KPI tracking be automated?
Yes — most modern analytics and reporting tools connect directly to data sources like Google Analytics, ad platforms, and CRMs, pulling KPI values automatically instead of requiring someone to update a spreadsheet by hand.
If your team tracks the right KPIs but still spends too long figuring out why one moved, ConvoData lets you ask that question in plain English and get a live answer with a suggested next step — plans start at $39/month.