


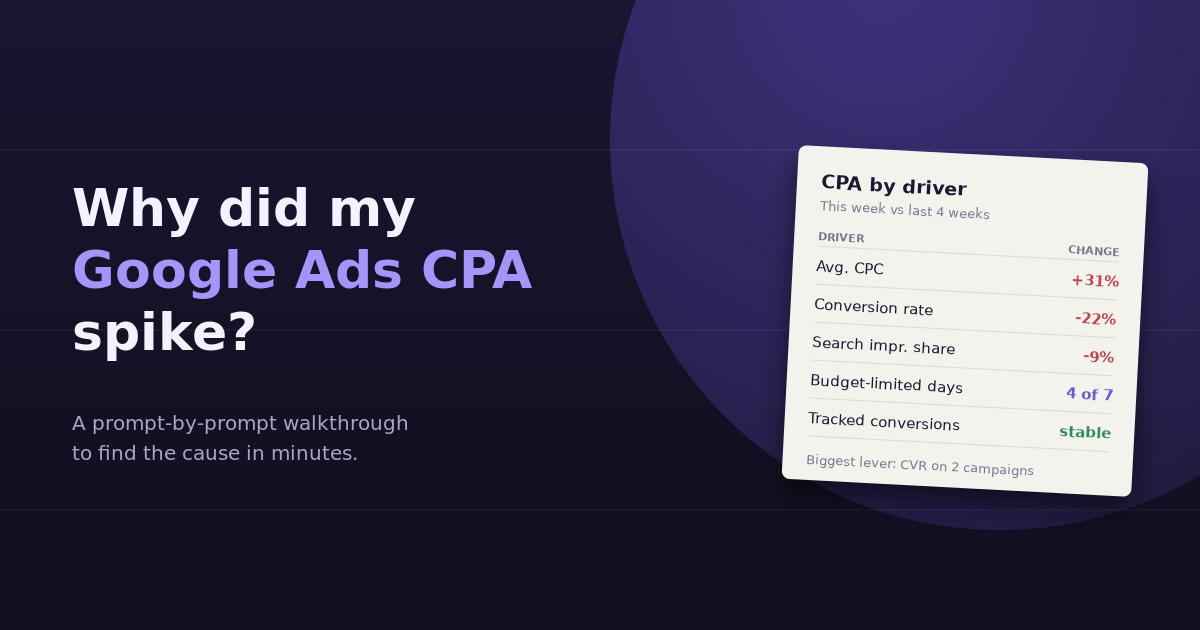
A Google Ads CPA spike rarely has a single cause, and the Google Ads interface doesn’t make it easy to find the one that matters. Cost per acquisition is just cost divided by conversions, so a spike means either you paid more per click, fewer clicks converted, or conversions stopped being counted. Each of those breaks down further, and the fastest way through is a fixed sequence of questions, asked in order, where each answer narrows the next.
This walkthrough uses that prompt-by-prompt approach. You can run it manually in Google Ads reports, or ask the same questions of a tool connected to your account. Either way, the logic is identical.
The CPA Equation, Broken Into Parts
Before asking anything, it helps to know what you’re decomposing:
CPA = Cost per click ÷ Conversion rate
If CPC rises 20% and conversion rate stays flat, CPA rises 20%. If CPC is flat and conversion rate falls 20%, CPA rises 25%. If both move, the effects compound. Every CPA spike traces back to one or both of these, plus a third possibility: tracking. If conversions stop being recorded, CPA spikes on paper while real performance may be unchanged.
So the first job is to work out which side of the equation moved.
Prompt 1: “Is the spike real, or is it a tracking problem?”
Start here, because it’s the cheapest problem to rule out and the most embarrassing to miss.
- Did conversions drop to zero or near zero on a specific day?
- Did a conversion action’s status change to inactive, or did “no recent conversions” appear?
- Do your backend numbers (CRM leads, Stripe payments, store orders) show the same decline?
- Did anyone change the conversion action, the tag, consent mode, or the website’s checkout or form recently?
If the backend is fine but Google Ads shows fewer conversions, you have a measurement problem. Fix it before touching bids or budgets, or automated bidding will “learn” from bad data and make things worse.
Prompt 2: “Which campaigns explain most of the CPA increase?”
Account-level CPA is an average, and averages hide things. Compare the spike period with a normal baseline (the previous 2 to 4 weeks works well) at campaign level, and rank by the change in total cost per conversion weighted by spend.
In most accounts, one or two campaigns explain most of the increase. A campaign with a small budget can double its CPA without moving the account average; a campaign with half your spend only needs a 15% rise to drive the whole spike. Focus on the campaigns that contribute most to the absolute change.
Prompt 3: “For those campaigns, did CPC rise, conversion rate fall, or both?”
This is the fork in the road.
| What changed | Likely causes | Next question |
|---|---|---|
| CPC up, conversion rate flat | More auction competition, bid strategy changes, Quality Score drops, seasonal demand | Prompt 4 |
| CPC flat, conversion rate down | Landing page issues, search term drift, offer or pricing changes, audience changes | Prompt 5 |
| Both moved | Often a targeting change (broader match types, new placements) bringing in pricier, less qualified traffic | Prompts 4 and 5 |
Prompt 4: “Why did CPC go up?”
If cost per click drove the spike, check these in order:
Auction insights
The Auction insights report shows impression share, overlap rate, and outranking share for competing domains. A new competitor appearing, or an existing one sharply increasing their impression share, is a common cause of CPC inflation, especially in short seasonal windows.
Bid strategy behavior
If a campaign uses Target CPA, Maximize Conversions, or Target ROAS, look at the change history. A recently raised target, a budget increase, or a strategy switch can push bids up while the algorithm re-learns. Check whether the bid strategy status shows “learning.”
Quality signals
Lower Quality Score components (expected CTR, ad relevance, landing page experience) raise the price you pay for the same position. A drop in expected CTR often follows ad copy changes or new competition in the ad results.
Impression share lost to rank vs budget
If search impression share lost to rank rose, you’re being outbid or out-qualified. If loss to budget rose, the campaign is capped, and smart bidding may be prioritizing pricier clicks within the limited budget.
Prompt 5: “Why did conversion rate fall?”
If CPC was steady but fewer clicks converted, the problem is usually after the click or in who you’re reaching.
Search terms
Open the Search terms report for the spike period and sort by cost. Broad match and Performance Max can drift into adjacent queries that bring clicks without intent. A handful of new, irrelevant terms with high spend and no conversions is one of the most common causes of conversion rate drops.
Landing pages
Compare conversion rate by final URL. Then check the landing page itself: did a form break, did page speed degrade, did someone change the offer or the pricing? Pair Google Ads data with GA4 landing page engagement to see whether visitors are leaving faster than before.
Device, location, and schedule
Segment by device, geography, and hour of day. A conversion rate drop concentrated on mobile often points to a mobile page problem. A drop concentrated in one region may mean a new targeting setting or a competitor’s local offer.
Audience and placement changes
For Display, Demand Gen, and Performance Max, review placements and audience signals. New, low-quality placements can quietly absorb budget.
Prompt 6: “What’s the smallest change that fixes most of it?”
By now you’ll usually have one or two specific causes. Resist the urge to rebuild the account. The most effective fixes are narrow:
- Add negative keywords for the specific drifting search terms
- Exclude the poor placements or locations that absorbed spend
- Roll back the bid target change or the budget change that triggered re-learning
- Fix the landing page problem and leave bidding alone while conversion rate recovers
- For competitive CPC inflation, accept a temporary rise or reduce bids on the least profitable segments rather than the whole campaign
After changing anything on a smart bidding campaign, allow time for the strategy to stabilize before judging the result. Making several large changes at once makes it impossible to tell which one worked.
A Worked Example
Account CPA rises from $48 to $71 over ten days. Tracking checks out: CRM leads fell in proportion to Google Ads conversions (Prompt 1). Two non-brand search campaigns explain 85% of the increase (Prompt 2). In both, CPC rose 31% while conversion rate fell 22% (Prompt 3).
Auction insights shows a new competitor with 40% overlap rate in one campaign (Prompt 4). The search terms report for the other campaign shows a cluster of informational “what is” queries pulling 18% of spend with no conversions, introduced after a switch to broad match (Prompt 5).
The fix: add negatives for the informational cluster, tighten match types in the second campaign, and leave the competitive campaign’s bid strategy alone while monitoring impression share. CPA returns to the low $50s within three weeks.
Running This Walkthrough Faster
Done by hand, each prompt means a new report, a new date comparison, and often an export. When your Google Ads account is connected to a conversational analytics tool, each step becomes a single question you can ask in sequence, with the numbers shown alongside the answer. That matters most for Prompt 1 and Prompt 5, where you need data from outside Google Ads, such as CRM leads or GA4 landing page engagement, to reach a confident diagnosis.
For reference points on what “normal” looks like before a spike, see our guide to PPC benchmarks, and for the full set of numbers worth watching, our breakdown of Google Ads metrics.
Frequently Asked Questions
What is a normal amount of CPA fluctuation in Google Ads?
Week-to-week swings of 10 to 20% are common, especially in lower-volume accounts where a handful of conversions changes the average a lot. A sustained rise of more than 25 to 30% over a week or two, or a sudden jump with no obvious seasonal reason, is worth investigating.
Can smart bidding cause a CPA spike?
Yes. Changing a Target CPA or ROAS target, raising budgets sharply, or switching bid strategies can put a campaign into a learning period where CPA is temporarily unstable. Check the change history and bid strategy status before assuming something external changed.
How do I tell if a CPA spike is caused by tracking?
Compare Google Ads conversions with a source of truth outside Google Ads, such as CRM leads, payment records, or store orders. If those numbers held steady while Google Ads conversions fell, the issue is measurement rather than performance.
Should I pause a campaign when its CPA spikes?
Usually not immediately. Pausing resets learning and hides the cause. Diagnose which segment, search term, or placement drove the increase and make a targeted change first. Pause only if the campaign is losing money and no quick fix is available.
Why did CPA rise when conversion volume stayed the same?
If conversions were flat and CPA rose, total cost went up. That means CPC increased, or the campaign spent more on clicks that didn't add conversions, often because of a budget increase or broader targeting.
Which report is most useful for diagnosing a conversion rate drop?
The Search terms report is usually the fastest place to find the cause, because search term drift is common with broad match and Performance Max. After that, compare conversion rate by landing page, device, and location.
When CPA spikes, you need the cause in minutes, not after an afternoon of exports. Connect Google Ads and GA4 to ConvoData, ask which campaigns and search terms drove the increase, and make the fix from the same chat. Plans start at $39/month.