


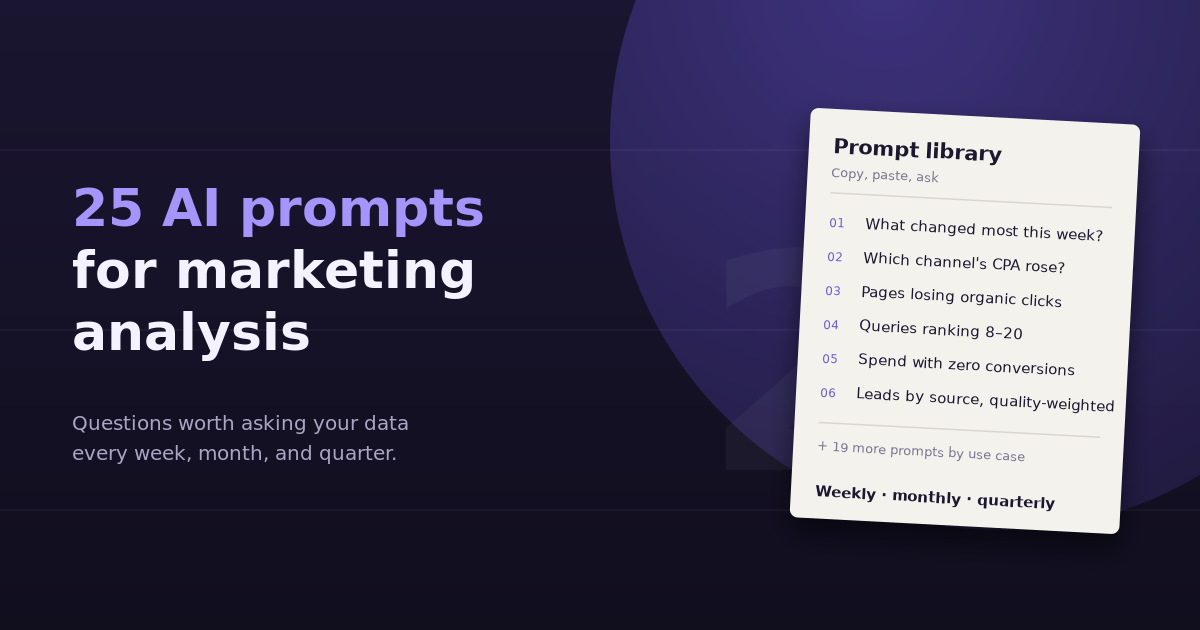
The difference between a useless AI answer and a useful one is almost always the question. “Analyze my marketing” gets a generic summary. “Which channel’s cost per lead rose most last month, and what drove it?” gets a ranking, a cause, and a next step. These AI prompts for marketing analysis are written to get the second kind of answer, grouped by the job they do and the cadence you’d use them on.
Each prompt assumes the AI can see your actual data, either through a connected analytics tool or a file you’ve provided. Copy them as written, then swap in your own date ranges, channels, and goals.
How to Get Better Answers From Any Prompt
Before the list, five rules that apply to all of them:
- Always include a time range and a comparison. “Last 28 days vs the previous 28 days” turns a number into a trend.
- Name the metric. Key events, sessions, CPA, ROAS, pipeline — not “performance.”
- Ask for the breakdown you need. By campaign, landing page, device, or source.
- Request the evidence. End with “show the numbers behind your answer” so you can check it.
- One decision per prompt. Chain prompts instead of stacking five questions into one.
Weekly Check-In Prompts
Use these every Monday to catch changes before they become problems.
- “What changed most across sessions, leads, spend, and revenue last week compared to the previous four-week average? Rank by size of change.”
A fast scan that tells you where to look first. - “Which campaigns spent more than $200 last week with zero conversions?”
The quickest way to catch wasted spend. Adjust the threshold to your account size. - “Which channel’s cost per lead rose the most week over week, and was it driven by higher costs or lower conversion rate?”
Separates price problems from conversion problems in one answer. - “Did any landing page with more than 500 sessions see its conversion rate drop by more than 20% last week?”
Catches broken forms and bad deployments early. - “Are we on pace to hit this month’s lead and revenue targets? Show actual vs expected to date.”
Turns a dashboard glance into a pacing check.
SEO and Content Prompts
- “Which pages lost the most organic clicks in Search Console over the last 28 days vs the previous 28, and did their position, impressions, or CTR change?”
The core traffic-drop diagnostic in one question. - “Which queries rank in positions 8 to 20 with more than 1,000 impressions, and which page ranks for each?”
Your striking-distance list, the highest-leverage SEO opportunities. - “Which blog posts get organic traffic but have the lowest key event rate in GA4?”
Pages that attract readers but don’t move them toward conversion. - “Which pages have high impressions but CTR below 1% in Search Console?”
Title and description rewrite candidates. - “Which topics do we get impressions for but have no dedicated page targeting?”
A first-party content gap analysis using your own Search Console data.
Paid Media Prompts
- “Which search terms spent the most last month without converting?”
Your negative keyword list, ready to review. - “Compare cost per conversion and conversion rate by device for each campaign. Where is the biggest gap?”
Finds bid adjustment and landing page opportunities. - “Which campaigns are limited by budget but have a CPA below our target?”
Where extra budget is most likely to pay off. - “How did CPM, CTR, and CPC change for our Meta and LinkedIn campaigns month over month, and which ad sets drove it?”
A cross-platform efficiency check. - “Which ads have run more than 30 days with declining CTR?”
Creative fatigue candidates.
Funnel and Revenue Prompts
- “What’s our cost per SQL by campaign last quarter, using first-touch attribution?”
Moves the conversation from cheap leads to qualified pipeline. Needs ad spend and CRM data together. - “Which lead sources have the highest MQL-to-SQL conversion rate, with at least 50 MQLs?”
Lead quality by source, with a minimum sample to avoid noise. - “Compare ROAS reported in Google Ads with revenue actually collected in Stripe, by campaign, for last month.”
Separates platform-reported value from real money. - “Where in the funnel did we lose the most volume this month compared to last — visits, sign-ups, activation, or purchase?”
Finds the leakiest stage. - “Which landing pages produce leads that become customers at the highest rate?”
Tells you which pages deserve more traffic, not just which get the most.
Quarterly and Strategic Prompts
- “Which channels grew and which shrank this quarter as a share of total leads and revenue? Show the trend over the last four quarters.”
A mix shift view for planning. - “If we moved 20% of budget from our highest-CPA channel to our lowest-CPA channel last quarter, what would the estimated impact have been, assuming current efficiency held?”
A simple scenario, with the key assumption stated. - “What were our top 10 pages by assisted conversions this quarter?”
Content that contributes without getting last-click credit. - “Which metrics in our monthly report haven’t changed meaningfully in six months?”
Candidates to remove from reporting, freeing space for metrics that drive decisions. - “Summarize this quarter’s performance in five bullet points for a leadership audience: what changed, why, and what we’re doing about it.”
Turns analysis into a stakeholder update. Always check the numbers before sending.
Chaining Prompts for Deeper Analysis
The most useful analysis usually comes from a sequence. Start broad, then follow the answer:
- “What changed most last week?” → organic leads down 18%
- “Which landing pages lost the most organic leads?” → three product pages
- “For those pages, did traffic or conversion rate fall?” → traffic fell, conversion rate held
- “Which queries lost clicks for those pages in Search Console?” → two high-volume queries lost about three positions each
Four prompts, a clear diagnosis, and a specific next step. Doing the same thing by hand means four reports across two tools.
What AI Analysis Still Gets Wrong
Even good prompts can produce misleading answers. Watch for:
- Small samples treated as trends. A 50% rise from two conversions to three isn’t news. Add minimum thresholds to prompts.
- Correlation presented as cause. “Traffic dropped after the redesign” doesn’t prove the redesign caused it. Ask what else changed.
- Silent assumptions. Which attribution model? Which date range? Calendar month or rolling 30 days? Ask the AI to state its assumptions.
- Answers without numbers. If a response describes a trend without showing figures, ask for the table.
These are the same mistakes human analysts make; the difference is that AI makes them faster and more confidently. Our guide to vanity metrics vs actionable metrics is a good filter for deciding which answers deserve action.
Building Your Own Prompt Library
The prompts above are a starting point. The best library is the one built around your business:
- Replace generic metrics with your actual KPIs and targets
- Add your own thresholds (minimum spend, minimum sessions) to filter out noise
- Save the prompts that led to real decisions, and drop the ones that never did
- Run the same prompts on the same cadence so answers are comparable over time
If you’re deciding which KPIs to anchor those prompts on, our guide to choosing, tracking, and acting on KPIs walks through the selection process.
Frequently Asked Questions
Do these prompts work in ChatGPT or Claude?
They work in any AI tool that can see the relevant data. With a general assistant, you'll need to upload exports or connect a data source first. With a conversational analytics tool connected to your marketing platforms, you can ask them directly against live data.
Why do my AI answers about marketing data feel generic?
Usually because the prompt is missing a metric, a time range, a comparison, or a breakdown. Adding all four, plus a request to show the numbers behind the answer, makes responses specific and checkable.
How many prompts should I run each week?
Three to five is plenty for most teams: a broad what-changed prompt, a wasted-spend check, and one or two diagnostic follow-ups based on what the first answer shows. Consistency matters more than volume.
Can AI prompts replace a marketing analyst?
They can replace much of the repetitive report-building and first-pass analysis. Judgment about what the numbers mean for the business, which tests to run, and how to communicate trade-offs still benefits from a person who knows the context.
Should I trust AI-generated numbers in reports to leadership?
Verify them first. Ask the AI to show the underlying figures, check key numbers against the source platform, and confirm the date range and attribution model before anything goes into a stakeholder report.
What's the most useful single prompt for a busy marketer?
A weekly what-changed prompt that compares last week to a four-week baseline across your main metrics and ranks the biggest movements. It tells you where to look before you spend time anywhere else.
These prompts work best when the data is already connected. Link your analytics, ad platforms, and CRM to ConvoData, ask any prompt from this list against live data, and act on the answer in the same chat. Plans start at $39/month.