


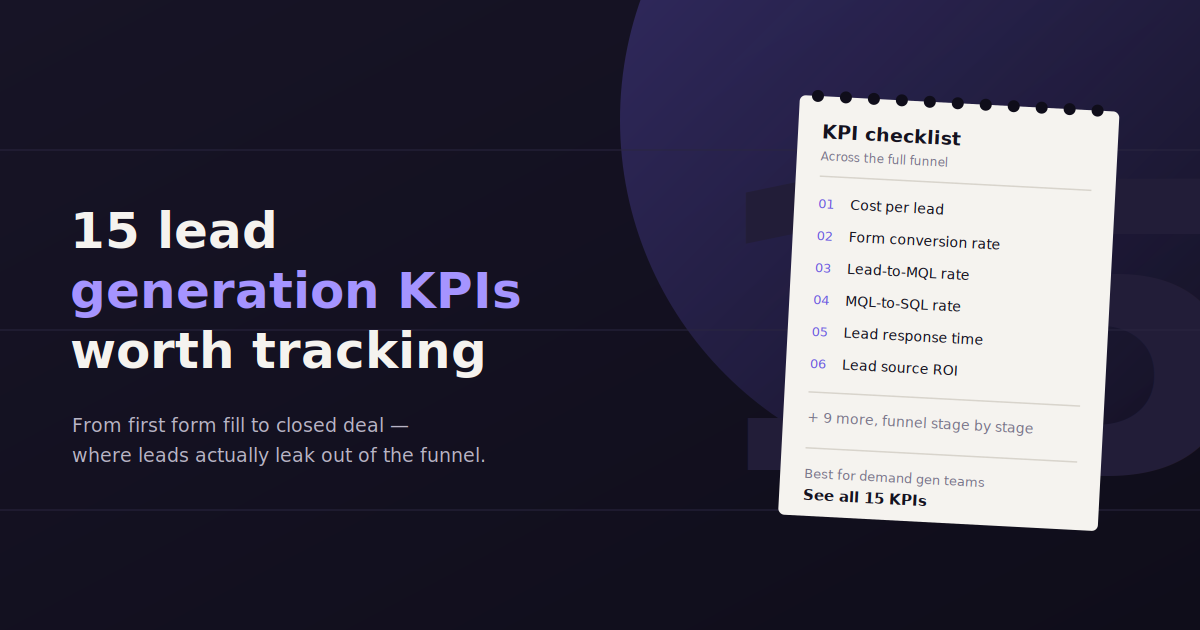
Lead generation KPIs are supposed to tell you whether your pipeline is healthy, but most teams track a handful of vanity numbers — total leads, total impressions — that don’t actually predict revenue.
The more useful KPIs sit one layer deeper: conversion rates between stages, cost efficiency by channel, and lead quality signals that show up before a lead ever reaches sales.
This guide breaks lead generation KPIs into four groups — cold outreach, paid ads, SEO, and overall funnel health — so you’re tracking the right metric for the right channel instead of one blended number that hides where the real problem is.
Not every business needs all 15. Pick the ones that map to the channels you actually run, and track those consistently rather than spreading attention thin.
What Counts as a Lead Generation KPI
A lead generation KPI measures something specific and actionable about how leads enter and move through your funnel — not just how many exist, but how efficiently and how well-qualified they are.
The goal is catching a problem early. A drop in lead quality shows up in these metrics weeks before it shows up as a revenue miss, which is exactly why tracking them matters more than just watching the top-line lead count.
KPIs for Cold Outreach
Positive reply rate — the percentage of outreach that gets a genuinely interested response, not just any reply. This is the clearest early signal of message-market fit.
Meeting booking rate — of those positive replies, how many convert into an actual scheduled call, since a reply that never becomes a meeting isn’t moving the pipeline forward.
Email bounce rate — a high bounce rate signals a data quality problem in your list, and left unchecked it can damage sender reputation and hurt deliverability for every future campaign.
KPIs for Paid Ads Performance
Return on ad spend (ROAS) — revenue generated per dollar spent, the most direct efficiency signal for any paid channel.
Cost per click (CPC) — useful for spotting rising competition or declining ad relevance before it shows up in a bigger metric like cost per lead.
Paid conversion rate — the percentage of paid clicks that convert into a lead, which isolates landing page and offer performance from the ad spend itself.
KPIs for SEO Performance
Organic clicks — traffic volume from search, the baseline metric for whether content and technical SEO work is paying off.
Average time on page — a proxy for content relevance and engagement, useful for spotting pages that rank but don’t actually hold attention.
Organic conversion rate — the percentage of organic visitors that convert into a lead, which shows whether the traffic SEO generates is actually the right audience.
KPIs for Overall Sales and Marketing Performance
Overall lead generation health is best tracked through marketing qualified leads (MQLs), MQL-to-SQL conversion rate, lead quality, cost per acquisition, average contract value, and customer lifetime value — together showing both volume and whether that volume is actually worth pursuing.
Marketing qualified leads (MQLs) — leads that meet a defined quality threshold, a more useful volume metric than raw lead count.
MQL-to-SQL conversion rate — the percentage of marketing-qualified leads that sales accepts as genuinely sales-ready, a key signal of alignment between the two teams.
Lead quality — a scored or subjective assessment of fit, often the most overlooked metric on this list. Companies that don’t screen leads for quality are flying partially blind on whether their volume is actually valuable.
Cost per acquisition (CPA) — total cost to acquire one paying customer, blending spend across every channel involved in that conversion.
Average contract value (ACV) — average revenue per closed deal, which changes how much CPA you can justify per channel.
Customer lifetime value (CLV) — total expected revenue per customer over the relationship, the number that ultimately determines whether your acquisition costs make sense.
Why Lead Quality Gets Overlooked
Lead quality is harder to measure than lead volume, so a lot of teams skip it and default to counting raw leads instead — a metric that’s easy to track but easy to game and easy to misread.
Only a little over half of companies actually screen their leads for quality in any systematic way, which means a meaningful share of teams are optimizing campaigns against a number that doesn’t reliably predict revenue.
A simple lead scoring model — based on firmographic fit, engagement behavior, and stated intent — doesn’t need to be sophisticated to be useful. Even a basic point system beats no screening at all.
Building a Simple Lead Scoring Model
A lead scoring model doesn’t need a data science team to be useful — a basic point system built in a spreadsheet or CRM field catches most of the value a far more sophisticated model would provide.
Start with three categories of signal, each contributing points toward a total score. Firmographic fit covers things like company size, industry, and job title matching your ideal customer profile. Engagement behavior covers actions like visiting a pricing page, downloading a resource, or attending a webinar. Stated intent covers anything the lead has directly told you, like requesting a demo or answering a qualifying question on a form.
Set a threshold score above which a lead automatically routes to sales as an MQL, and review that threshold quarterly against actual close rates. If leads crossing the threshold aren’t converting to closed deals at a reasonable rate, the scoring weights need adjusting — usually by giving more weight to intent signals and less to firmographic fit alone, since a lead that looks right on paper but hasn’t shown any real interest is still a weak lead.
Involve sales in setting the initial thresholds rather than having marketing define them in isolation. Sales teams usually have an intuitive sense of which lead characteristics actually predict a good conversation, and building that intuition into the scoring model from the start avoids months of friction over whether marketing is sending “real” leads.
Firmographic fit (0-40 points): company size, industry, job title match against your ideal customer profile.
Engagement behavior (0-40 points): pricing page visits, content downloads, webinar attendance, email engagement.
Stated intent (0-20 points): demo requests, qualifying form answers, direct replies expressing interest.
Example threshold: a combined score above 60 routes automatically to sales as an MQL; scores between 30 and 60 go into a nurture sequence; below 30 gets deprioritized.
A Worked Example: Diagnosing a Lead Quality Problem
Say total lead volume is up 20% quarter over quarter, but the MQL-to-SQL conversion rate has dropped from 35% to 22%. On the surface this could look like a sales execution problem, but it’s worth checking the marketing side of the funnel first.
Breaking lead volume down by channel shows the increase is almost entirely from a new paid social campaign, while outreach and SEO-driven lead volume stayed flat. Comparing lead scores by channel shows the new paid social leads are scoring well on engagement (they’re clicking and downloading) but poorly on firmographic fit — many don’t match the target company size or industry at all.
This points to a targeting problem in the paid social campaign’s audience settings, not a decline in sales team performance or a broken scoring model. The fix is adjusting the campaign’s audience targeting to better match the ideal customer profile, rather than pushing sales to work harder on a batch of leads that were never going to convert well in the first place.
This kind of diagnosis is only possible because lead quality was being tracked by channel rather than as one blended number. A team watching only total MQL count and overall MQL-to-SQL rate would have seen the same conversion rate decline, but without a channel breakdown, the natural next step would have been questioning sales performance instead of the actual root cause sitting one level upstream in campaign targeting.
How to Build a Lead Generation KPI Dashboard
Group your chosen KPIs by channel rather than blending everything into one view — cold outreach, paid, and SEO have different healthy benchmarks and shouldn’t be judged against the same bar.
Include both a volume metric and an efficiency or quality metric for every channel. Volume alone tells you activity is happening; efficiency tells you whether it’s worth the spend.
Set a review cadence tied to how fast each channel moves — paid ad KPIs are worth checking weekly since spend is live daily, while SEO KPIs are more useful reviewed monthly given how slowly organic performance typically shifts.
Turning KPI Tracking Into Faster Decisions
Tracking lead generation KPIs across multiple channels usually means checking several separate platforms manually. A conversational reporting tool can pull the same cross-channel answer directly, cutting the time between noticing a KPI shift and acting on it.
The hardest part of KPI tracking usually isn’t defining the metrics, it’s the manual work of checking five different platforms every week to see where each one stands.
A tool like ConvoData can shorten that loop by connecting directly to your ad platforms, GA4, and CRM, then answering questions like “which channel had the best MQL-to-SQL rate last month” on demand, without a separate dashboard-building step.
That matters most for the KPIs that move fast — catching a paid conversion rate slide in week one instead of at the end-of-month report is the difference between a small budget adjustment and a wasted month of spend.
Once you are tracking lead quality, that data is only useful if it is actually captured somewhere your sales team can act on it — see our explainer on what CRM stands for and how it works. And if content is one of your lead sources, our breakdown of 14 content marketing metrics that actually matter covers how to measure that channel specifically.
Frequently Asked Questions
What are the most important lead generation KPIs?
MQL-to-SQL conversion rate, lead quality, cost per acquisition, and channel-specific efficiency metrics like ROAS and organic conversion rate tend to matter more for revenue than raw lead volume alone.
How many lead generation KPIs should a business track?
Most teams don't need all 15 — pick a handful per active channel, including at least one volume metric and one efficiency or quality metric for each, rather than tracking every possible KPI at once.
What's the difference between an MQL and an SQL?
A marketing qualified lead (MQL) meets a defined engagement or fit threshold set by marketing; a sales qualified lead (SQL) has been reviewed and accepted by sales as genuinely ready for outreach. The conversion rate between the two shows how well the teams are aligned.
Why is lead quality hard to measure?
Unlike lead volume, quality requires a scoring model based on fit, engagement, and intent signals, which takes more setup than simply counting leads — a large share of companies skip this step entirely and rely on volume alone.
How often should lead generation KPIs be reviewed?
Cadence should match how fast the channel moves — paid ad KPIs are worth checking weekly since spend is live daily, while SEO KPIs are typically more useful on a monthly review given how slowly organic performance shifts.
What tool can track lead generation KPIs across multiple channels?
A conversational reporting tool like ConvoData can connect to ad platforms, analytics, and CRM data and answer specific KPI questions directly, which is faster than manually checking each platform separately every review cycle.
How do I build a basic lead scoring model?
Assign points across three categories: firmographic fit (company size, industry, job title), engagement behavior (page visits, downloads, webinar attendance), and stated intent (demo requests, qualifying answers). Set a score threshold above which leads route to sales, and adjust the weighting quarterly based on which scores actually correlate with closed deals.
If lead volume is up but MQL-to-SQL rate drops, is that a sales problem?
Not necessarily. Check lead quality by channel first — a new campaign that drives volume but scores poorly on firmographic fit is often a targeting problem on the marketing side, not a sign that sales is failing to convert good leads.
Stop checking five platforms to answer one KPI question — connect your data to ConvoData and ask it directly which channel needs attention this week, starting at $39/month.