


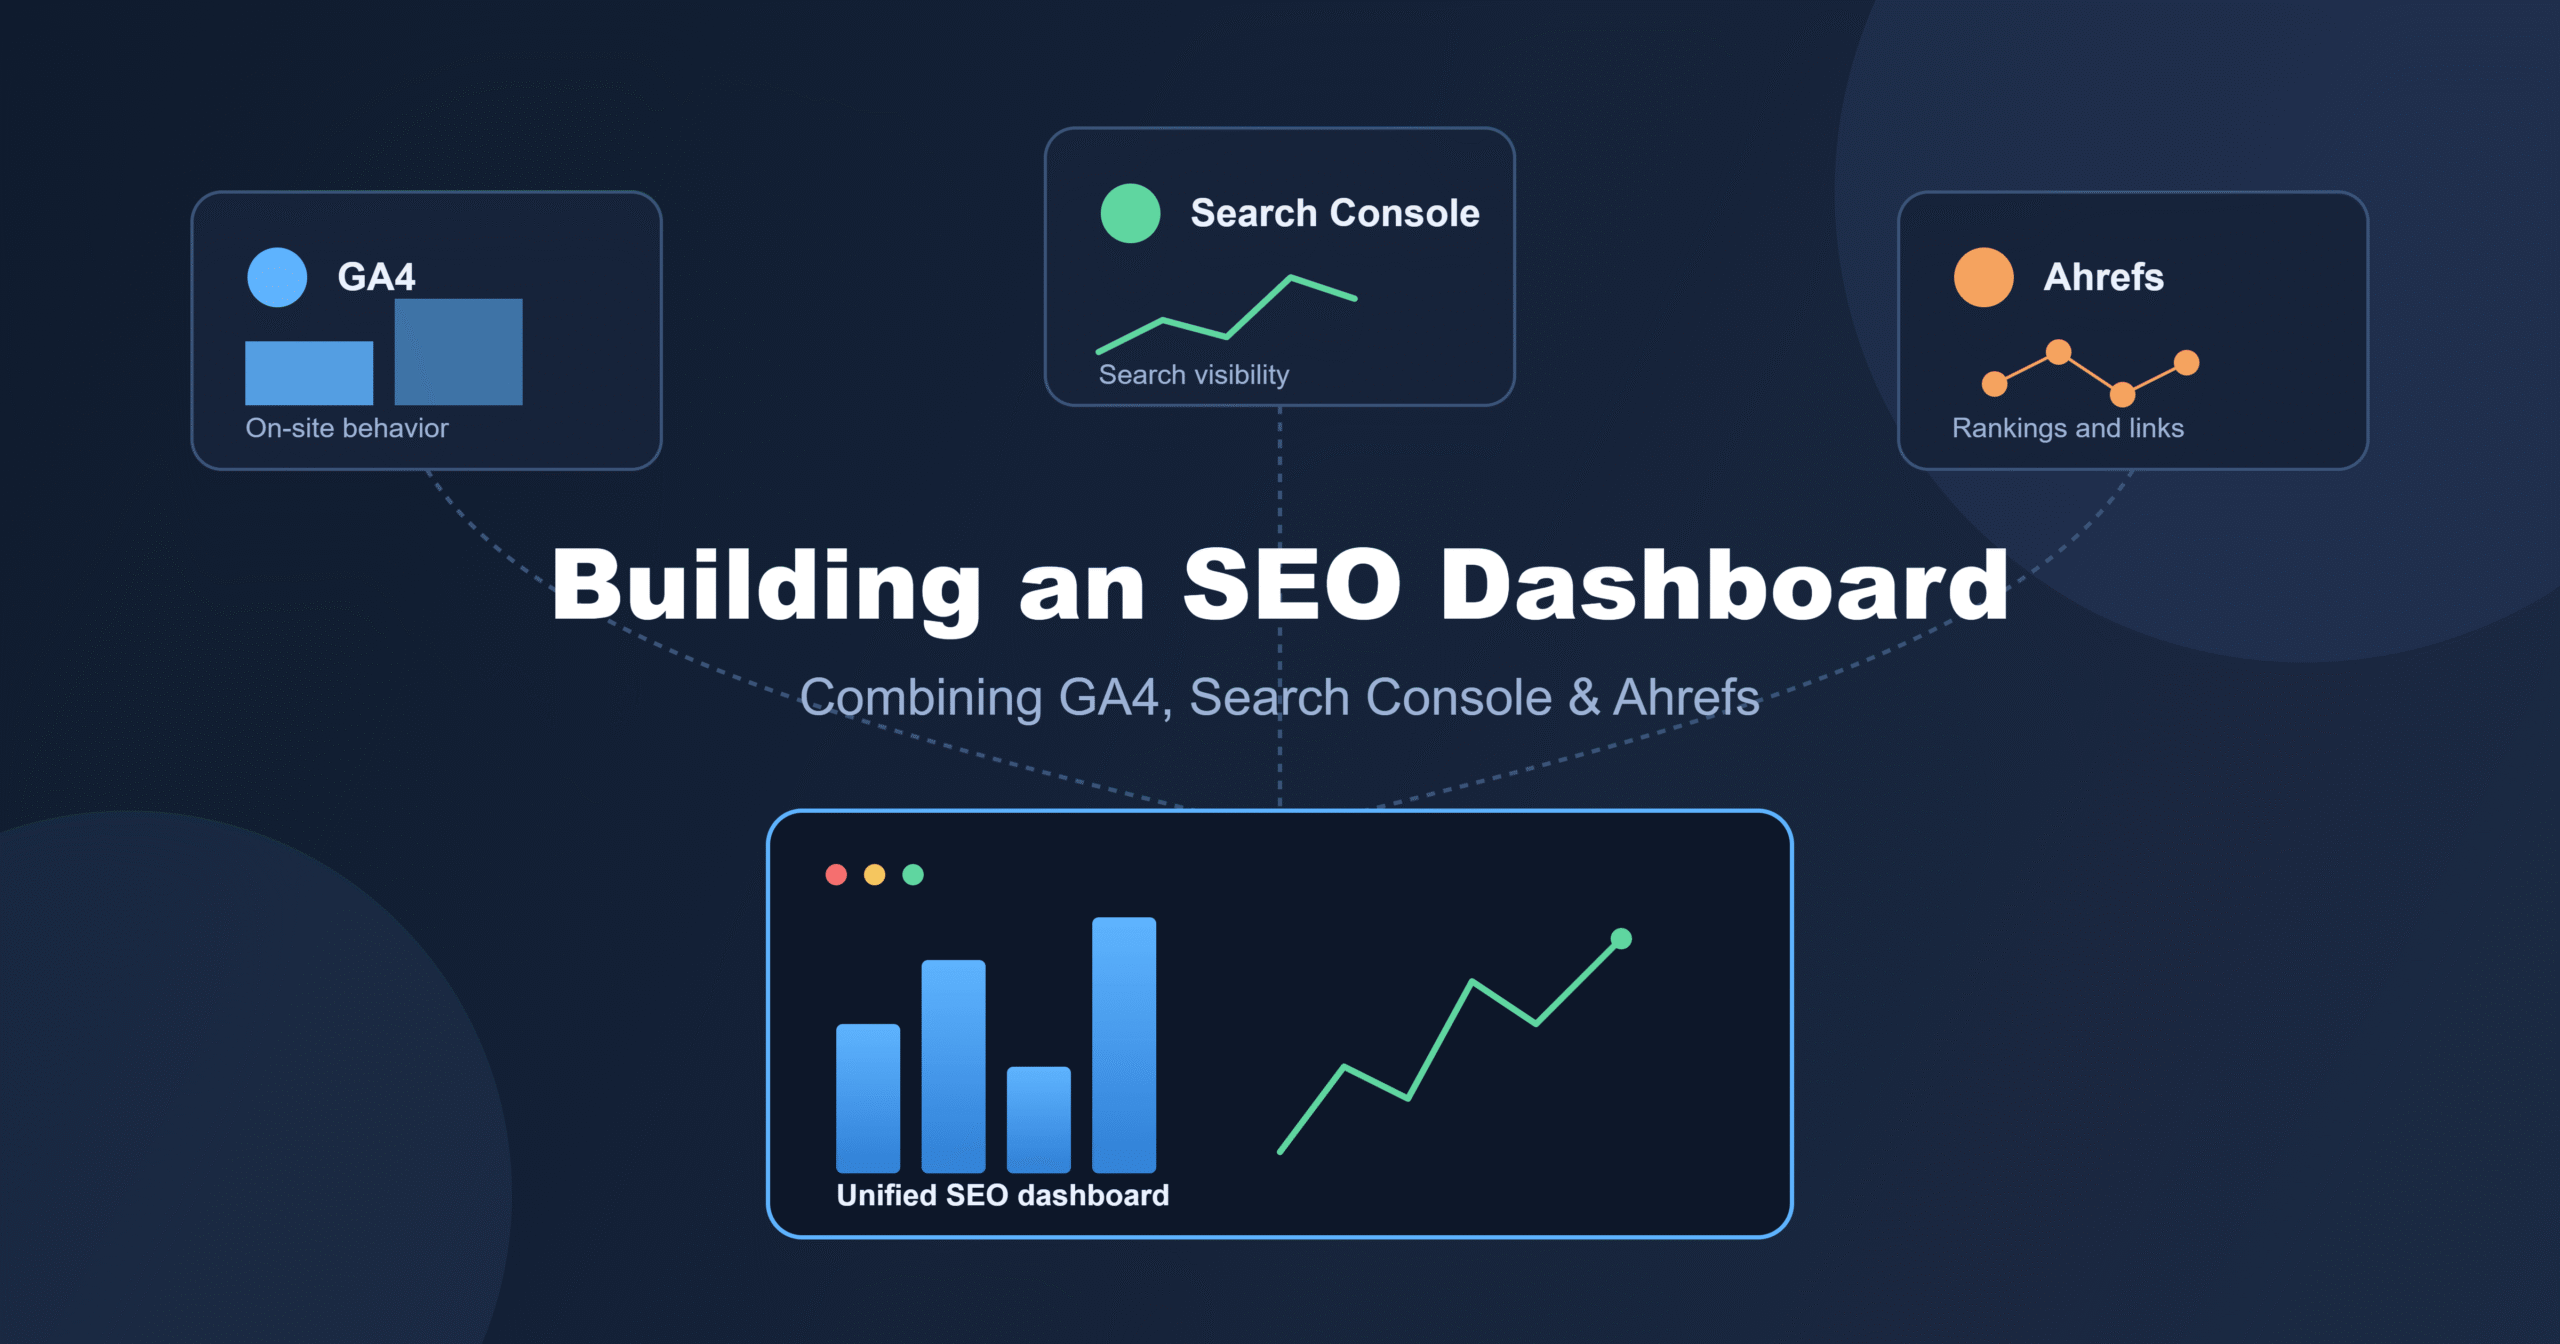
If you manage SEO for a website, you already know the problem: your traffic story is split across three tabs. GA4 tells you what happened after someone landed on your site. Search Console tells you how they found it. Ahrefs tells you where you stand against competitors and what’s linking to you. None of them, on their own, answers the question you actually care about — “is my SEO working, and what should I do next?”
Building an SEO dashboard that combines GA4, GSC, and Ahrefs solves this. Instead of three logins and three mental models, you get one place where visibility, behavior, and competitive position sit side by side. This guide walks through why each tool covers a different piece of the picture, exactly which metrics are worth pulling from each one, two practical ways to build the dashboard, and the discrepancies you need to understand before you trust the numbers.
Why You Need All Three Tools (Not Just One)
Each of these three platforms was built to measure something different, and none of them was designed to be a complete SEO reporting tool by itself.
GA4 measures behavior after arrival. It tells you what people did on your site — pages viewed, time engaged, events completed, conversions. What GA4 does not do natively is tell you which keywords brought someone to your site. Google removed keyword-level referral data from Google Analytics back in 2013, when it moved organic search to HTTPS by default. That single change is the reason this whole integration exists — without connecting Search Console, GA4 shows your organic traffic as one anonymous bucket.
GSC measures visibility in search results. It shows impressions, clicks, average position, and — critically — the actual queries triggering those impressions. This is data GA4 simply doesn’t have. But GSC has a limitation of its own: for privacy reasons, it doesn’t report every single query. Very low-volume or unusual search terms get grouped or omitted, so any Search Console query report is a partial, not complete, view of what’s driving your traffic.
Ahrefs measures your standing in the wider search landscape. Rankings, backlinks, keyword difficulty, and competitor visibility are not things GA4 or GSC track at all — those two tools only know about your site. Ahrefs (or a comparable third-party tool) is what tells you whether a ranking drop is because of something you did, or because a competitor outranked you.
Put together, you get the full funnel: visibility (GSC) → competitive context (Ahrefs) → on-site behavior and outcomes (GA4). Leave one out and you’re reading a book with a missing chapter.
The Metrics That Actually Belong on Your Dashboard
A common mistake is pulling every available metric into a dashboard because the connector allows it. That produces a report nobody reads. Here’s what’s worth including from each source, organized by what question it answers.
| Source | Metric | What It Tells You |
|---|---|---|
| GSC | Impressions | How often your site appeared in search results |
| GSC | Clicks | How many of those impressions turned into visits |
| GSC | Average CTR | Whether your titles/meta descriptions are compelling enough |
| GSC | Average position | Where you tend to rank for tracked queries |
| GSC | Top queries | The actual search terms driving impressions and clicks |
| GA4 | Organic sessions | Visits attributed to organic search |
| GA4 | Engaged sessions / engagement rate | Whether visitors actually interact, not just land and leave |
| GA4 | Conversions from organic | Whether organic traffic is doing anything for the business |
| GA4 | Landing page performance | Which pages pull the most organic weight |
| Ahrefs | Keyword rankings | Position tracking, ideally alongside historical trend |
| Ahrefs | Referring domains / backlinks | Authority signals competitors and Google both weigh |
| Ahrefs | Share of Voice | Your visibility relative to named competitors |
| Ahrefs | Keyword difficulty (for target terms) | Whether new content targets are realistic |
Notice the pattern: GSC tells you what’s happening in search results, GA4 tells you what happens after the click, and Ahrefs tells you how you compare to everyone else trying to rank for the same terms. A dashboard missing any one of those three lenses will always leave a gap in the story.
Method 1: Build It Yourself in Looker Studio
Looker Studio (free) is the most common way marketers combine these sources without paying for a dedicated dashboard tool.
Step 1: Connect GA4
In Looker Studio, create a new report, add a data source, and search for “Google Analytics.” Select your GA4 property. This gives you access to all GA4 dimensions and metrics — sessions, engagement, conversions, landing pages.
Step 2: Connect Search Console
Add a second data source and search for “Search Console.” Select the property that starts with sc-domain: for the most complete data (domain-level properties capture more than URL-prefix properties). This adds impressions, clicks, CTR, position, and query data to your report.
Step 3: Add Ahrefs (or another rank tracker)
GA4 and GSC don’t provide page-level ranking history or backlink data — that’s Ahrefs’ job. Most professional rank-tracking tools offer either direct API access or a Google Sheets export you can pull into Looker Studio as a third data source. This is usually the most manual part of the setup, since it typically means scheduling a Sheets export rather than a live connector.
Step 4: Build the visual layout
A layout that works well for most teams:
- Top row: organic sessions, impressions, clicks, average position (trend over time)
- Second row: top queries and top landing pages, side by side
- Third row: ranking movement and Share of Voice from Ahrefs
- Bottom: conversions from organic traffic, to tie SEO work to business outcomes
The catch with this method
Looker Studio dashboards need maintenance. Google Sheets connectors break when sheet structures change. GA4’s default attribution model (data-driven) and GSC’s model (last non-direct click) count things differently, so your GA4 organic sessions and GSC clicks will rarely match exactly — that’s expected, not a sign something is broken, but it confuses people the first time they see it. Budget time to re-check connectors periodically, and document the discrepancy so stakeholders don’t flag it as an error every reporting cycle.
Method 2: Use a Conversational AI Layer Instead of a Static Dashboard
The Looker Studio approach works, but it has a structural limitation: a dashboard shows you numbers, not answers. You still have to look at the chart, notice something odd, and go dig through each tool to figure out why.
This is the gap tools like ConvoData are built for. Instead of maintaining a static report, you connect GA4, Search Console, Google Ads, and Ahrefs to a single conversational interface and ask questions directly — “why did organic traffic drop last week” or “which pages are ranking but not converting” — and get an answer that already cross-references all connected sources, rather than a chart you have to interpret yourself.
The trade-off is different, not smaller: a Looker Studio dashboard gives you full control over layout and is free, while a conversational tool trades some of that manual control for speed — you’re not clicking through GA4, then GSC, then Ahrefs individually to piece together a diagnosis. For teams without time to build and maintain a dashboard, or without a dedicated analyst, that speed is often the more practical option.
Which method fits depends on your situation:
- Choose Looker Studio if you want full visual control, have someone to maintain the connectors, and mainly need a report you review on a schedule.
- Choose a conversational tool if you want quick answers to specific questions without building infrastructure, or if your team asks ad hoc questions more often than it reviews scheduled reports.
Common Discrepancies You Need to Understand
Every marketer who builds this dashboard hits the same three surprises. Knowing them ahead of time saves a lot of confused Slack messages.
GA4 sessions won’t match GSC clicks. Different attribution windows and models mean these numbers measure related but not identical things. Expect them to be close, not identical.
GSC doesn’t show every query. Very low-volume or unusual queries get filtered out for privacy. This is why some marketers layer a dedicated keyword-tracking tool over GSC data — to see rankings for terms GSC itself won’t fully report on.
Ahrefs rankings and GSC position won’t always agree. Ahrefs checks rankings from its own crawl locations and schedule; GSC reports Google’s own recorded average position for your actual traffic. Treat Ahrefs as your competitive benchmark and GSC as your source of truth for your own site’s real search performance.
None of these discrepancies mean your dashboard is broken. They mean each tool is measuring from a different vantage point — which is exactly why combining them, rather than trusting any single one, gives you the more accurate picture.
A Practical Setup Checklist
- Confirm GSC is verified at the domain level, not just a single subdomain or URL prefix
- Link GSC to GA4 directly inside GA4’s admin settings (this alone unlocks basic query data inside GA4 reports)
- Decide which 8–10 metrics actually matter for your team, using the table above as a starting point
- Choose your build method — Looker Studio for full control, a conversational AI layer for speed
- Document the known discrepancies (attribution models, query filtering) somewhere your team can reference, so they don’t get re-litigated every month
- Review and prune metrics quarterly — dashboards accumulate clutter fast
Frequently Asked Questions
Does GA4 show keyword data on its own? No. GA4 has not shown organic keyword data natively since Google Analytics moved away from keyword referrals in 2013. You need to link Search Console to GA4 to see any query-level data inside GA4’s interface.
Why don’t my GA4 and Search Console numbers match? They use different attribution models — GA4 typically defaults to data-driven attribution, while GSC uses last non-direct click. Some variance between the two is normal and doesn’t indicate a tracking error.
Is Looker Studio free? Yes, Looker Studio itself is free to use. The GA4 and Search Console connectors are free as well. Costs come from any paid tools you connect alongside them, like Ahrefs or Semrush.
Do I need Ahrefs specifically, or will any rank tracker work? Any credible rank-tracking and backlink tool will fill this role. Ahrefs is one of the most widely used, but Semrush, Moz, and others cover similar ground. The point is having a source for competitive and ranking data that GA4 and GSC don’t provide.
Why does Search Console hide some of my search queries? GSC filters out very low-volume or unusual queries to protect user privacy. It’s a normal part of how the tool works, not a setup issue, but it means your query report is a partial view of total search demand.
Can I build this dashboard without technical or developer help? Yes. Looker Studio’s data source connectors for GA4 and GSC are point-and-click. The Ahrefs connection is usually the only step that needs a Sheets export or API setup, which is more involved but still doable without a developer for most standard use cases.
How often should I update or review the dashboard? Weekly for active monitoring of traffic and rankings; monthly for a full review including conversions and Share of Voice; quarterly for pruning metrics that aren’t being used.
What’s the fastest way to spot a traffic drop using this setup? Check GSC impressions first — a drop there points to a visibility issue (ranking loss, indexing problem). If impressions are steady but GA4 sessions dropped, the issue is more likely CTR or a tracking/attribution change. Cross-check Ahrefs rankings to see if a competitor gained ground in the same window.
Key Takeaway
No single tool — GA4, GSC, or Ahrefs — gives you the complete SEO picture on its own, because each one was built to measure a different stage of the search journey. The dashboard worth building is the one that puts visibility, on-site behavior, and competitive standing in the same view, whether that’s a Looker Studio report you maintain yourself or a conversational tool that answers questions across all three sources directly. Start with the metrics table above, pick the build method that matches how your team actually works, and document the discrepancies up front so nobody mistakes normal variance for broken tracking.